⏱ 24 min read
Microservices Architecture Diagrams for Enterprises: Best Practices & Examples Sparx EA best practices
Explore microservices architecture diagrams for enterprises, including key components, diagram types, best practices, and real-world examples to improve scalability, governance, and system design clarity. how architecture review boards use Sparx EA
microservices architecture diagrams, enterprise microservices, microservices diagram examples, microservices architecture design, enterprise architecture diagrams, system design for microservices, scalable microservices architecture, microservices best practices, distributed systems diagrams, enterprise system architecture Sparx EA training
Introduction
Microservices have become a practical architecture style for enterprises that need to scale delivery across products, regions, channels, and business units. In large organizations, however, the real difficulty is not deciding to break an application into services. It is making a complex estate understandable: hundreds of services, multiple integration patterns, hybrid cloud platforms, security controls, compliance boundaries, shared tooling, and legacy systems that remain indispensable long after modernization begins.
That is where architecture diagrams prove their worth. In an enterprise setting, they are not just documentation artifacts. They are working tools for decision-making. Good diagrams help architects, engineers, platform teams, security leaders, operations teams, and executives see how business capabilities map to technology, where ownership sits, how services interact, and where dependencies or risks may hinder delivery. A useful diagram does more than list components; it exposes design choices in a form people can challenge, refine, and govern.
No single diagram can answer every enterprise question. An executive may need a domain-level view of business capabilities and strategic platforms. A solution architect may need a service interaction view to assess coupling and runtime behavior. A platform or operations team may need a deployment view showing clusters, regions, failover paths, and shared infrastructure dependencies. Effective enterprise diagramming therefore depends on a set of views, not a single master picture. Each view should exist for a reason and support a specific decision.
The strongest diagrams also reflect the estate as it actually is. Enterprises rarely move from monoliths to neatly bounded microservices in a single step. Modernization happens in stages. Legacy systems stay on the critical path, shared databases outlive their intended lifespan, centralized integration layers continue to mediate traffic, and target-state patterns coexist with tactical exceptions. A diagram that hides this transitional architecture may look cleaner, but it is less useful for planning, governance, and risk management. A better diagram shows both the intended direction and the constraints that still shape delivery.
Consistency matters just as much as accuracy. At scale, diagrams need a shared visual language for services, data stores, interaction styles, trust boundaries, ownership, and platform controls. Without that discipline, diagrams become hard to compare across portfolios and lose much of their value as communication and governance tools. free Sparx EA maturity assessment
This article outlines a structured approach to enterprise microservices diagramming. It covers the strategic role of diagrams, the main diagram types and when to use them, the notation and components that make them readable, and the ways diagrams should surface scalability, resilience, security, and governance. It also examines common anti-patterns, explains how to keep diagrams accurate over time, and shows how diagrams help align stakeholders during transformation. The central point is simple: the right set of diagrams helps enterprises scale technology and teams together without losing clarity or control.
1. The Strategic Role of Microservices Architecture Diagrams
Enterprise diagrams create value when they are treated as decision tools rather than static illustrations. Their strategic role is to connect distributed technical design with business priorities, operating model choices, and governance requirements.
One of their most immediate benefits is that they make ownership visible. In large enterprises, delivery problems often stem less from technical complexity than from blurred accountability across product teams, platform groups, security functions, and infrastructure teams. A strong architecture diagram shows bounded contexts, service ownership, key interfaces, and dependencies on shared platforms. That visibility becomes especially important during reorganizations, mergers, regional expansion, and platform transformation, when hidden dependencies can slow delivery or create avoidable conflict.
Diagrams also support portfolio planning. Modernization decisions are rarely isolated. Changes to identity, data platforms, cloud landing zones, API standards, or integration tooling often affect many domains at once. A well-structured diagram gives leaders a common frame for asking whether a proposed change advances enterprise direction or simply adds another layer of fragmentation. A domain map may reveal duplicate capabilities across business units. A service interaction diagram may show that a supposedly distributed architecture still depends heavily on a central integration hub. In either case, the diagram turns a broad architectural concern into a concrete investment discussion.
Their governance role is equally important. Principles such as loose coupling, secure-by-design services, and observability by default are easy to state and much harder to verify. Diagrams give architecture review boards and platform leaders a practical way to see whether those principles appear in real designs. They can show where security controls are enforced, how regulated data crosses boundaries, where resilience mechanisms sit, and whether critical business flows depend on fragile shared components. In one retail organization, for example, a review of a returns platform diagram showed that every refund request still passed through a single legacy pricing service hosted on-premises. The issue had not appeared in narrative documentation, but the diagram made the bottleneck impossible to ignore.
Diagrams are also useful for separating healthy standardization from hidden centralization. A service may look autonomous at the application level while still relying on a shared CI/CD pipeline, a common identity provider, a central event platform, or a single observability stack. Those dependencies may be entirely appropriate, but they can also become bottlenecks or systemic risks if they are not acknowledged. By making them visible, diagrams help architecture teams decide whether they are deliberate platform services or accidental constraints.
Just as important, diagrams improve communication across organizational layers. Executives can see how technology supports capability evolution. Architects can test boundary quality and coupling. Platform and operations teams can identify where resilience, compliance, and support expectations are concentrated. A payment modernization initiative, for instance, may look straightforward at executive level—split payments into independent services—but the supporting diagrams might reveal cross-border tax logic, anti-fraud dependencies, and settlement batch windows that materially change the transformation plan.
Their strategic value comes from giving these groups a shared view of how the enterprise intends to scale delivery without giving up control.
2. Core Diagram Types and Their Use Cases
Because no single view serves every audience, enterprises should standardize a small set of diagram types. A portfolio of views is more effective than a single all-purpose drawing.
2.1 Business Capability or Domain Map
The domain map is the highest-level architectural view. It shows major business domains, subdomains, and bounded contexts without going deep into implementation detail. Its primary purpose is strategic alignment: clarifying where services should align to business capabilities, where ownership should sit, and which capabilities may justify platform treatment.
This view is especially useful during organizational redesign, product operating model adoption, and modernization planning. It helps prevent teams from defining service boundaries around legacy applications rather than business value streams. It is also often the best starting point for executive communication because it connects architecture directly to business structure.
In a global insurance group, for example, a domain map may separate Policy Administration, Claims, Billing, Customer Identity, and Broker Management. That view often reveals where regional teams have built overlapping customer functions that should either be consolidated or explicitly treated as distinct bounded contexts.
2.2 Context Diagram
A context diagram places a service, domain, or platform in relation to users, channels, upstream systems, downstream dependencies, and external partners. It helps readers understand what the subject interacts with and where its responsibility ends.
In enterprise settings, context diagrams are valuable because they expose dependencies that often disappear in team-level conversations: identity providers, enterprise data platforms, SaaS systems, partner integrations, and legacy systems of record. They are commonly used in solution definition, onboarding, and risk review.
An IAM modernization effort is a good example. A context diagram can show that customer channels, workforce applications, and partner portals still rely on different identity providers, making token flows and trust boundaries visible before consolidation begins.
2.3 Service Interaction or Container Diagram
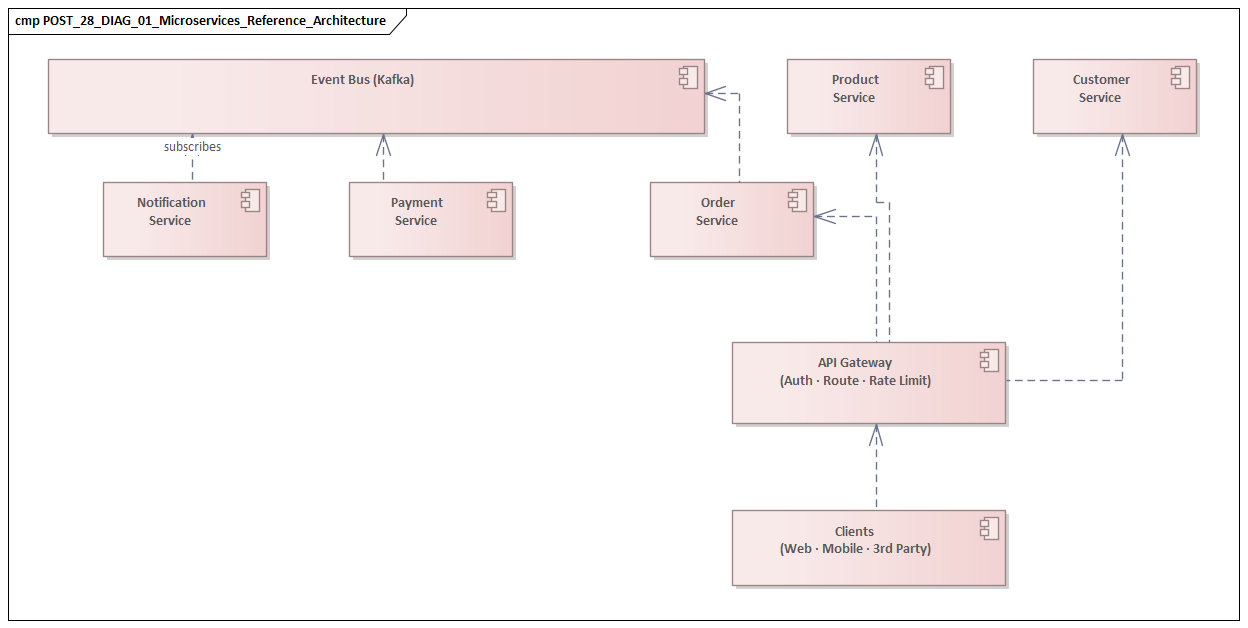
This is the main runtime design view. It shows services, APIs, databases, brokers, gateways, and other components, along with the relationships between them. Its purpose is to reveal request flows, communication patterns, transactional boundaries, and integration choices.
For enterprise teams, this is often the point where architectural quality becomes visible. A system that sounds modular in narrative form may look very different when diagrammed. Long synchronous call chains, shared persistence, or heavy reliance on central orchestration quickly expose a distributed monolith. That is why this view is one of the most important diagrams in design review.
A realistic example is an e-commerce checkout flow where Checkout Service calls Pricing, Promotions, Inventory, Fraud, Payment, and Order synchronously in sequence. On paper, that may appear service-oriented. In diagram form, it often becomes clear that the checkout path is too fragile and too latency-sensitive to scale reliably.
2.4 Event Flow or Integration Diagram
Where the service interaction view emphasizes direct runtime relationships, the event flow diagram focuses on asynchronous communication: event publication, subscriptions, streaming platforms, and integration mediation.
In larger enterprises, this view is often essential because many cross-domain processes are coordinated through events rather than direct API calls. It helps teams examine decoupling, contract ownership, event propagation, and the role of shared integration platforms. It can also expose anti-patterns such as hidden consumers, overuse of canonical schemas, or unclear ownership of event contracts.
A common case is a Kafka-based order flow in which Order Service publishes OrderCreated, while Billing, Fulfilment, and Customer Notifications subscribe independently. A useful diagram makes topic ownership, replay requirements, schema versioning, and dead-letter handling explicit.
2.5 Deployment Diagram
The deployment view shows where workloads run: cloud accounts, clusters, regions, availability zones, edge locations, or on-premises environments. It supports platform, security, and operations concerns rather than logical design alone.
Enterprise diagrams need to reflect reality, including hybrid and transitional states. Deployment diagrams are often the clearest way to show that modern services still depend on data centers, mainframes, or regional hosting constraints. They are critical for assessing resilience, latency, data residency, and disaster recovery posture.
In a banking environment, for instance, the diagram may show customer-facing APIs running in two public cloud regions while payment settlement remains tied to a mainframe in the primary data center. That single view can reshape both resilience planning and migration sequencing.
2.6 Operational or Cross-Cutting Concern Diagram
This view highlights observability pipelines, service mesh components, policy enforcement points, secrets management, CI/CD tooling, and security controls. It is particularly useful in enterprises where architectural quality depends as much on platform capabilities as on application design.
It should complement, not replace, the service interaction or deployment view. Its purpose is to make cross-cutting controls visible without overloading the core runtime diagrams.
2.7 Standardizing the Set
A practical enterprise approach is to define these views as a standard documentation model. Teams should know which views are required, what decision each one supports, and what minimum metadata each must include. That consistency is what allows notation, governance, maintenance, and stakeholder alignment to work in a disciplined way.
3. Essential Components and Notation Standards
Once an enterprise agrees on the core diagram types, the next step is to establish a consistent visual language. Without it, the portfolio of views becomes difficult to compare and much weaker as a governance asset.
3.1 Service Boundaries and Ownership
Enterprise microservices diagrams should show more than technical components; they should also show ownership. Services should be associated with domains, product teams, or platform groups. That can be done through color, grouping, swimlanes, or labels.
Ownership matters because enterprise architecture is inseparable from operating model design. If a business flow crosses multiple domains, the diagram should make that visible. Reviewers can then see where handoffs, escalation paths, and accountability gaps may emerge.
3.2 Interaction Types
Not all arrows mean the same thing. Diagrams should distinguish synchronous API calls, asynchronous messaging, event publication, batch transfers, and human-triggered workflows. Each interaction style carries different implications for latency, coupling, resilience, and security.
A disciplined notation system—different line styles, arrowheads, or labels—is usually enough to make those differences clear without cluttering the drawing. This matters most in service interaction and event flow views, where hidden assumptions about communication style can lead to poor design decisions.
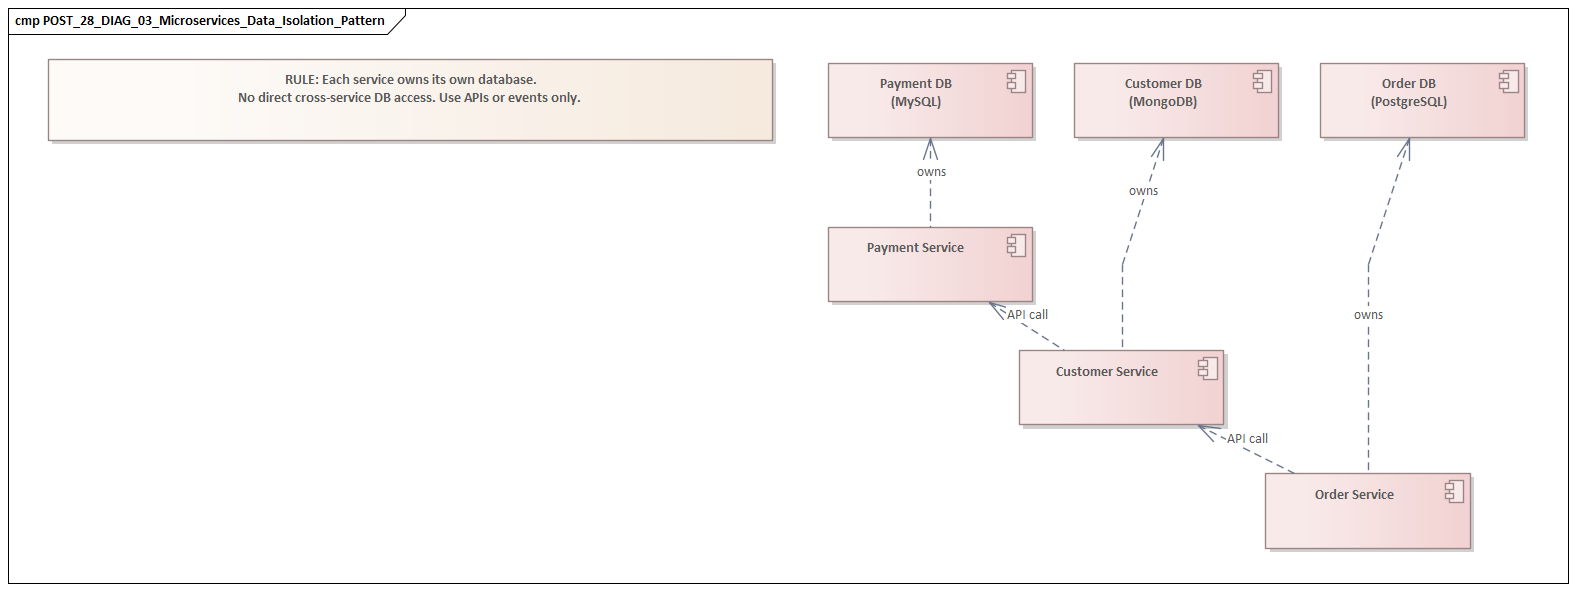
3.3 Data Stores and Data Ownership
One of the most important architectural questions is whether services own their own data or rely on shared persistence. Diagrams should therefore show databases, caches, analytical stores, and external systems of record explicitly.
The aim is not to model every schema. The point is to show control and dependency: which service owns which data, where replication occurs, where reporting dependencies exist, and where data crosses trust or regulatory boundaries. That makes diagrams far more useful for spotting coupling and compliance exposure.
3.4 Cross-Cutting Platform Components
API gateways, identity providers, service mesh layers, message brokers, secrets managers, policy engines, and observability tooling should appear when they materially affect design or runtime behavior.
Shared platform components are often where systemic dependencies live. Leave them out, and the diagram may imply that services interact directly and without constraint when the opposite is true.
3.5 Trust Boundaries and Network Zones
In security-sensitive enterprises, diagrams should show trust boundaries, network segments, cloud account boundaries, partner edges, and regulated zones. These elements are essential in architecture review because they show where identities are established, where data leaves controlled environments, and where additional controls are required.
3.6 Labeling Discipline
Names should reflect business or product meaning rather than internal code names. Interfaces should be labeled with protocol or contract type where relevant, such as REST, gRPC, Kafka topic, or file transfer. Regions, environments, and external parties should be named consistently.
Poor labeling can weaken an otherwise strong diagram. In enterprise settings, clarity of naming is often as important as structural correctness.
3.7 Lightweight Standards Over Heavy Formalism
Many organizations draw from C4, UML, ArchiMate, or internal conventions. The exact framework matters less than consistency. A useful enterprise standard defines a small set of symbols, mandatory legends, and clear rules for ownership, interaction types, trust boundaries, and metadata.
That foundation matters because diagrams are expected to surface scalability, resilience, security, and governance. The notation has to support those concerns without becoming so formal that teams stop using it.
4. Designing Diagrams for Scalability, Resilience, Security, and Governance
A diagram becomes far more valuable when it reveals architectural fitness, not just structure. Enterprise diagrams should make quality attributes visible enough to support review and decision-making.
4.1 Scalability
From a scalability perspective, diagrams should show where horizontal growth is expected and what may limit it. That includes stateless services, stateful bottlenecks, cache layers, partitioning strategies, traffic concentration points, and dependencies on shared infrastructure such as databases, gateways, or brokers.
This matters because enterprises often discover that an architecture described as distributed still funnels through a few common components. A diagram should make those concentration points obvious so teams can decide whether they are intentional platform choices or architectural risks.
Where relevant, diagrams should also distinguish user traffic, batch processing, and event volume. Those load patterns stress systems in different ways and may require different scaling strategies. A customer portal may generate modest daytime API traffic but trigger overnight batch spikes when statement generation and archival jobs run against the same data stores.
4.2 Resilience
Resilience should appear as a first-class design concern. Diagrams should show redundancy across regions or zones, failover paths, retries, circuit breakers, dead-letter queues, and degradation mechanisms where they materially affect service behavior.
Service autonomy can be deceptive if end-to-end flows remain fragile. A resilience-aware diagram allows architects to evaluate whether partial failure can be tolerated and where fallback behavior exists. It should also distinguish between resilience provided by the platform and resilience implemented inside services, since that affects accountability and testing scope.
For example, if a claims intake service can continue accepting submissions while a downstream document-classification engine is unavailable, the diagram should show the queue, retry policy, and degraded business path rather than implying a hard synchronous dependency.
4.3 Security
Security-relevant structure should be visible in the diagram, not left entirely to prose. Useful diagrams show where identities are established, how tokens are propagated, where secrets are managed, where encryption terminates, and where data moves between internal zones, partners, cloud environments, or regulated regions.
This is particularly important for enterprises pursuing zero-trust models. A zero-trust architecture cannot be assessed from service boxes alone; it requires visibility into authentication, authorization, segmentation, and policy enforcement across the full path.
In practice, an IAM modernization diagram might show a legacy LDAP still serving workforce applications, a cloud identity platform issuing OIDC tokens for customer channels, and a phased migration of service-to-service authentication to workload identities. That level of detail is often what separates a security review from a branding exercise.
4.4 Governance
Governance is best shown through architecture metadata and annotations rather than blocks of policy text. Diagrams can indicate data classification, business criticality, lifecycle status, standard-versus-exception components, and services subject to stricter controls.
That makes review faster because stakeholders can immediately see where additional scrutiny is needed. It also helps detect architectural drift, especially when exceptions begin to cluster around particular domains or platforms. A lifecycle overlay might flag one payment service as still running an out-of-support Java version, prompting a remediation deadline rather than another waiver.
4.5 Using Overlays
A practical enterprise method is to maintain a stable core diagram and apply overlays for scale, resilience, security, and governance. This keeps the base view readable while allowing each quality attribute to be examined at the right level of detail.
It also reinforces a central principle: no single diagram should answer every question. The same architectural model can support multiple focused reviews if it is structured well.
5. Common Challenges and Anti-Patterns
Even when enterprises understand the need for multiple views and consistent notation, diagram quality often declines in predictable ways. Most problems can be traced to unclear purpose, poor scope control, or weak maintenance discipline. fixing Sparx EA performance problems
5.1 Diagram Sprawl
Large organizations produce many diagrams across programs, domains, and platforms. Without curation, those views become inconsistent in notation, naming, and level of detail. Readers then spend more time decoding diagrams than learning from them.
The issue is not the number of diagrams. Multiple views are necessary. The real problem is the absence of a controlled structure explaining how those views relate to one another.
5.2 The “Everything on One Page” Anti-Pattern
One of the most common mistakes is trying to show domains, services, APIs, events, controls, infrastructure, and deployment in a single picture. The result is usually unreadable and serves no audience well.
This defeats the purpose of view separation. Executives lose strategic clarity, engineers lose runtime clarity, and risk teams lose control clarity.
5.3 The Marketing Diagram
The opposite mistake is the overly abstract diagram: a few polished boxes labeled “API Layer,” “Data Platform,” or “Customer Services,” connected by generic arrows. These diagrams may work in presentation decks, but they are weak in design review or transformation planning because they hide responsibility and dependency.
5.4 False Independence
Some diagrams present services as cleanly decoupled while omitting shared databases, centralized release pipelines, common runtime libraries, or dependencies on a small number of platform teams. That creates a misleading picture of autonomy.
Hidden centralization often matters more than visible API calls. If those dependencies are not shown, leaders may underestimate coordination cost, resilience risk, or operational bottlenecks.
5.5 Ignoring Transitional Architecture
Another serious mistake is diagramming only the target state. Enterprises modernize through coexistence: temporary adapters, duplicated capabilities, partial data replication, and legacy systems that remain critical. Omitting those realities makes the diagram far less useful for sequencing and risk management.
A clean future-state picture may be appropriate for strategy discussion, but delivery planning requires the messy middle as well.
5.6 Static Diagrams That Age Immediately
A diagram updated only during major governance checkpoints quickly becomes historical rather than operationally useful. Outdated diagrams are dangerous because they create false confidence.
That is why maintenance has to be built into the operating model rather than treated as occasional cleanup.
6. Maintaining Diagram Accuracy Over Time
The long-term value of enterprise architecture diagrams depends less on how they are first drawn and more on how faithfully they continue to reflect reality. In fast-moving organizations, architecture changes through service decomposition, platform upgrades, cloud migration, security updates, and team realignment. Maintenance is therefore not clerical work; it is an architecture capability.
6.1 Treat Diagrams as Managed Architecture Assets
Each diagram should have an owner, a defined purpose, a review cadence, and clear update triggers. Typical triggers include interface changes, deployment topology changes, new external dependencies, data classification changes, and ownership shifts.
This turns diagrams from optional documentation into governed assets and helps distinguish authoritative views from illustrative ones.
6.2 Connect Updates to Delivery Workflows
The most accurate diagrams are maintained through the same processes that govern code and infrastructure. Teams can require updates as part of architecture decision records, pull requests, release readiness checks, or service onboarding workflows.
Where possible, diagrams should be version-controlled alongside code, API specifications, or infrastructure-as-code. That creates traceability and reduces the gap between implementation and documentation.
6.3 Use Model-Driven or Diagram-as-Code Approaches Where Appropriate
Static drawing tools still have value for conceptual and executive views, but operationally important diagrams often benefit from structured definitions and versioning. Tools such as Structurizr, PlantUML, Mermaid, and architecture modeling platforms can improve consistency and maintainability.
In more mature environments, metadata from service catalogs, cloud inventories, Kubernetes platforms, API gateways, or observability tools can validate or partially generate architecture views. The aim is not automation for its own sake, but less manual effort and greater confidence.
6.4 Establish a Lightweight Metadata Model
A diagram is easier to maintain when each service or platform component carries standard attributes such as owner, lifecycle state, criticality, data sensitivity, deployment environment, and integration type.
This supports governance and quality-attribute overlays. It also creates alignment between diagramming, service catalogs, support models, and architecture reporting.
6.5 Use a Federated Operating Model
Central architecture teams should define standards, templates, and review criteria, but they should not try to maintain the entire estate alone. Product and domain teams are best placed to maintain service-level views. Platform teams should maintain shared platform and deployment views. Enterprise architecture should curate cross-domain models and reference patterns.
At enterprise scale, this federated model is usually the only sustainable way to keep diagrams current.
6.6 Measure Diagram Quality
Useful indicators include the percentage of critical services with current diagrams, alignment between diagrams and service catalog records, time to update diagrams after major change, and the number of governance findings caused by outdated views.
Metrics like these help move diagram maintenance from a subjective concern to an observable architecture capability.
7. Using Diagrams to Align Stakeholders and Support Transformation
When maintained well, architecture diagrams become active coordination tools. Their enterprise value is often most visible here: not in repositories, but in planning sessions, governance reviews, and transformation programs.
7.1 Creating a Shared Language
Different stakeholders need different levels of abstraction. Business leaders need to see capability evolution, legacy dependence, and investment priorities. Engineering teams need to see service dependencies, release coordination points, and runtime implications. Security and operations teams need to see trust boundaries, controls, and support-critical paths.
A multi-view approach makes it possible to communicate the same architectural reality at the right level for each audience without losing consistency.
7.2 Improving Planning and Sequencing
Enterprise delivery often slows because dependencies are discovered too late: shared APIs are not ready, data contracts are unclear, platform capabilities are assumed, or security controls were never designed in. Well-structured diagrams make those constraints visible early.
That visibility helps program leaders distinguish parallelizable work from tightly coupled work, set more realistic delivery plans, and reduce surprise coordination. In a telecom transformation, for example, a simple dependency view may show that order capture can move ahead of billing modernization, but number provisioning cannot because both old and new channels still depend on the same network inventory service.
7.3 Supporting Transformation Decisions
Large-scale modernization rarely follows a single clean path. Enterprises need to decide how to isolate domains, apply the strangler pattern to a monolith, introduce event-driven integration, consolidate duplicated capabilities, or shift workloads across hosting models.
Transition views are especially useful here. They allow stakeholders to compare options visually, assess how much coupling is being removed, identify temporary complexity, and sequence change more deliberately. This is where honest diagrams are more valuable than elegant ones.
7.4 Making Governance More Concrete
Architecture reviews often become abstract when teams debate principles without a concrete system model. A diagram grounds the conversation. Security teams can point to trust boundaries and policy enforcement points. Operations teams can identify fragile dependencies. Domain teams can explain ownership and justify local exceptions.
That makes governance more evidence-based and less dependent on hierarchy or opinion. In practice, this is often where an architecture board decides whether a Kafka topic can be shared across domains, whether a legacy IAM component can remain for one more release, or whether a non-standard database version needs a retirement plan.
7.5 Capturing Organizational Learning
As services are delivered across domains, recurring patterns start to emerge: strong boundary designs, repeated integration mistakes, common dependencies on a few shared components, or platform capabilities that consistently reduce complexity. Capturing those patterns visually helps enterprises turn project experience into reusable architectural knowledge.
In that way, diagrams support not only communication but also architectural learning and operating model improvement.
Conclusion
Microservices architecture diagrams matter in the enterprise because they make complexity discussable before it turns into delivery delay, operational fragility, or governance overhead. Their value does not come from illustrating microservices as a concept. It comes from making architecture testable: do service boundaries support business change, do shared platforms enable autonomy rather than constrain it, and can the current landscape evolve without excessive coordination cost?
The most effective enterprise approach is not to produce one comprehensive diagram, but to maintain a disciplined set of views: domain, context, interaction, event, deployment, and cross-cutting control views. Those views should use consistent notation, show ownership and dependency clearly, and represent both target-state intent and transitional reality. Overlays for scalability, resilience, security, and governance should build on that common foundation rather than compete with it.
Enterprises should also treat diagramming as an operating capability. Diagrams need owners, standards, update triggers, and integration with delivery workflows. They should be maintained close to the teams that change the architecture, while central architecture functions provide templates, metadata standards, and review discipline. Without that operating model, even well-designed diagrams quickly lose trust.
Enterprises do not benefit from having more diagrams. They benefit from having the right diagrams, used at the right moments, to support real decisions. When that discipline is in place, microservices architecture diagrams become a durable way to align stakeholders, guide modernization, and scale both technology and teams with clarity. Sparx EA guide
Frequently Asked Questions
How are microservices architectures documented in enterprise EA?
Microservices are documented using UML Component diagrams (service structure), Deployment diagrams (container and infrastructure topology), and Sequence diagrams (inter-service interactions). In ArchiMate, each microservice appears as an Application Component with exposed Application Services and dependencies modeled as Serving relationships.
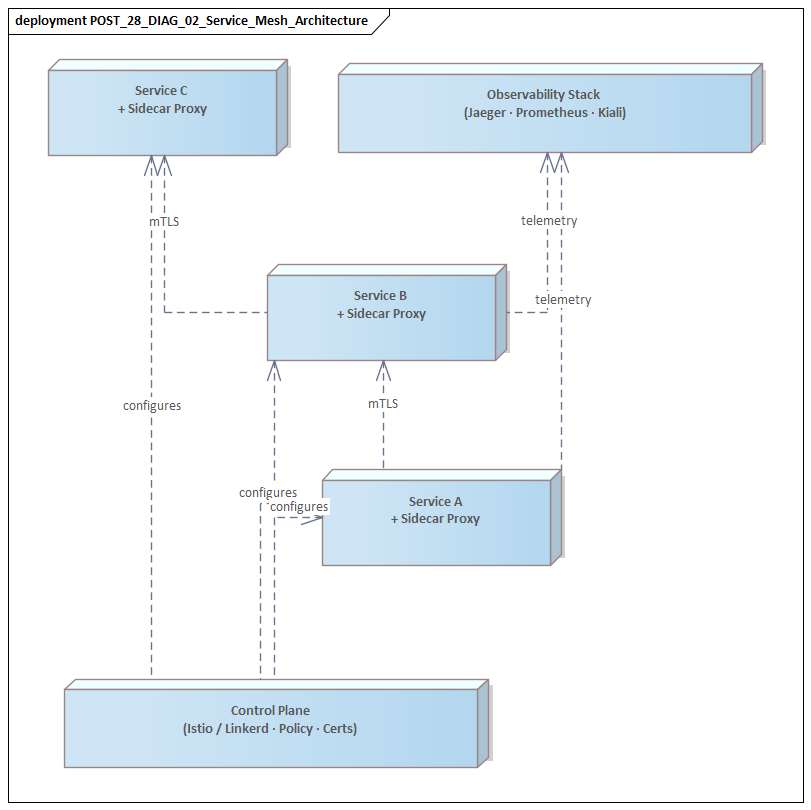
What is service mesh architecture?
A service mesh is an infrastructure layer that manages service-to-service communication in a microservices architecture. It provides mutual TLS, load balancing, circuit breaking, retries, and observability without requiring each service to implement these capabilities individually. Istio and Linkerd are common implementations.
How do you model microservices data isolation?
Each microservice should own its own data store, with no direct database sharing between services. In UML or ArchiMate, this is modeled by assigning each Application Component its own database node and showing that inter-service data access goes through APIs, not direct database queries.