⏱ 25 min read
Modeling Distributed Systems with UML: Architecture Diagrams, Components, and Deployment how architecture review boards use Sparx EA
Learn how to model distributed systems with UML using component, deployment, sequence, and class diagrams. Explore practical techniques for documenting scalable, reliable software architecture.
modeling distributed systems with UML, UML for distributed systems, distributed systems architecture, UML component diagram, UML deployment diagram, UML sequence diagram, software architecture modeling, system design documentation, scalable system architecture, enterprise architecture UML
Introduction
Distributed systems now underpin most enterprise landscapes. Customer channels, internal platforms, analytics pipelines, partner integrations, and operational tooling are no longer built as single applications. They are assembled from services that communicate across networks, deploy independently, and rely on shared infrastructure. That shift brings familiar advantages—scalability, resilience, faster delivery, and clearer team ownership—but it also changes the nature of architecture work. The central questions are no longer limited to function. They include placement, communication, trust, failure handling, and operational dependency.
That is where UML remains useful. It is sometimes dismissed as too formal for cloud-native delivery, but that criticism usually reflects poor use rather than a flaw in the notation. In distributed systems, informal sketches often break down once multiple teams, environments, and platforms are involved. Architects need a way to distinguish logical structure from runtime topology, show how requests and events move across boundaries, and make hidden dependencies visible before they become production issues.
Used well, UML does not create documentation for its own sake. It gives teams a common language for discussing decisions that shape real outcomes: whether interactions are synchronous or asynchronous, where data ownership sits, how trust is enforced, what fails together, and which dependencies limit autonomy. Those decisions affect latency, availability, compliance, observability, and cost. UML helps because it can show them from several angles without forcing everything into a single diagram.
That multi-view approach matters in enterprise settings. A component diagram can define service responsibilities and ownership boundaries. A sequence or activity diagram can show how a business capability moves through APIs, queues, and external providers. A deployment diagram can reveal where workloads actually run, which infrastructure they share, and where trust boundaries sit. Together, those views connect business intent, technical design, and operational reality.
Consider a retail order platform. On a whiteboard, it may appear to be a clean set of services: checkout, payment, inventory, and shipping. A UML model quickly exposes the harder questions. Does checkout wait synchronously for fraud scoring? Does inventory reserve stock through an API call or by consuming an event? Are payment and order services deployed in separate regions, or do they share the same message broker and database failover strategy? Those distinctions are architectural, not cosmetic. Sparx EA training
This article takes a practical view of UML for distributed systems. It focuses on the diagram types and modeling practices that add the most value in enterprise environments: defining service boundaries, representing communication patterns, showing runtime topology, and making scalability, resilience, and governance concerns explicit. The aim is straightforward: model selectively, keep each view tied to a real architectural question, and avoid diagrams that look complete while hiding the decisions that matter.
Why UML Still Matters for Distributed Systems Architecture
Many teams assume UML belongs to an earlier generation of architecture. In practice, distributed systems make the need for structured modeling more acute, not less. As services proliferate across domains, clouds, and delivery teams, informal diagrams rarely provide enough precision to support design reviews, resilience assessments, or governance decisions. They are useful for conversation, but not always for alignment. free Sparx EA maturity assessment
UML still matters because it separates concerns cleanly. No single view can explain a distributed system. A component diagram shows responsibilities and dependency direction. A sequence diagram traces requests, events, retries, and acknowledgments. A deployment diagram shows where workloads run and which failure domains or trust zones they share. When those views are consistent, stakeholders can follow a design decision from logical intent to runtime consequence.
That traceability is important because distributed systems often fail through interaction rather than isolated defects. Latency accumulates across hops. Retries amplify load. Shared platforms create coupling that remains invisible until a broker, identity service, or control plane degrades. A static box-and-arrow view may suggest independence where little exists. UML becomes valuable when the behavioral and deployment perspectives are modeled alongside structure.
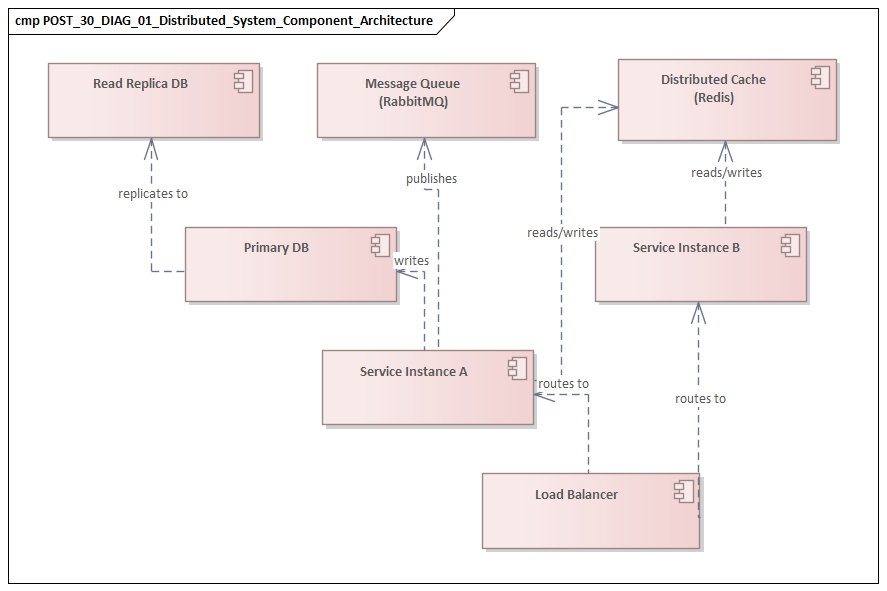
Take a common event-driven pattern. At the component level, order management, billing, and fulfillment may appear loosely coupled because they communicate through Kafka topics rather than direct APIs. The deployment view may tell a different story: all three domains depend on one shared Kafka cluster in a single region, supported by one operations team. The logical design suggests autonomy; the runtime design reveals a shared failure domain. That is precisely the kind of gap architecture documentation should expose.
UML also helps when architecture spans organizational boundaries. Enterprise systems typically involve application teams, platform engineering, security, operations, data teams, and external providers. Each group uses its own terminology and tooling. UML offers a neutral representation that supports cross-functional review. Security teams can reason about trust boundaries and token flows. Platform teams can assess runtime implications. Application teams can validate service contracts and interaction patterns without relying on vendor-specific diagrams.
Governance is another reason UML remains relevant. Enterprises need artifacts stable enough to support modernization planning, risk review, and impact analysis. If a synchronous integration is replaced with event-driven messaging, stakeholders need to understand more than the new technology choice. They need to see how consistency changes, where retries now belong, what dependencies shift to the broker, and how support responsibilities move across teams. UML diagrams can capture that intent with enough structure to support approval and enough flexibility to remain useful after the meeting.
A financial services example makes the point. A bank replacing a legacy customer identity platform with a cloud identity provider may need more than a target-state picture. Reviewers will want to see authentication flows, trust boundaries, token validation points, dependencies on legacy directories, and fallback behavior during tenant outage. A sequence diagram and deployment diagram often answer those questions more clearly than pages of prose.
UML should not compete with code, deployment manifests, service catalogs, or observability tools. Those artifacts describe implementation and current state. UML explains architectural intent: why responsibilities are separated, what assumptions exist about runtime behavior, and where the meaningful boundaries are. In distributed systems, that distinction matters. The challenge is not just technical complexity. It is complexity spread across teams, platforms, and time. UML remains useful because it makes that complexity discussable, reviewable, and easier to evolve.
Core UML Diagram Types for Distributed System Modeling
Not every UML diagram earns its keep in distributed systems. In enterprise practice, a small set usually provides most of the value because it answers the questions architects actually face: what is responsible for what, how do parts interact, where do they run, how does state change, and what operational dependencies exist? The goal is not completeness. It is usefulness.
Component diagrams
Component diagrams are often the best starting point for logical architecture. They define service boundaries, major interfaces, and dependency direction without dragging the discussion too early into infrastructure detail. In distributed systems, they help separate customer-facing channels, domain services, shared platforms, integration adapters, and third-party providers. enterprise architecture guide
Their real value lies in clarifying responsibility. A good component view shows which capabilities are independently deployable or governed and where coupling exists through APIs, events, or shared data stores. It should highlight architectural seams rather than internal implementation. In an IAM modernization program, for example, a component diagram might distinguish the customer identity service, workforce directory, token service, policy engine, and legacy LDAP adapter. That immediately shows which capabilities are strategic and which are transitional.
Deployment diagrams
Deployment diagrams provide the runtime perspective that component diagrams cannot. They show where components execute and what infrastructure hosts or connects them: clusters, virtual networks, regions, gateways, brokers, databases, and managed services. This is the view that reveals whether logical separation is matched by operational separation.
That distinction matters. Two services owned by different teams may appear independent in a component diagram but still share a database cluster, service mesh, or identity provider. A deployment view makes those shared dependencies visible. In hybrid and regulated environments, it also shows where workloads cross cloud boundaries, on-premises zones, or restricted network segments.
Sequence diagrams
Sequence diagrams are essential when the concern is interaction behavior. They show call order, synchronous versus asynchronous communication, and the points where latency or failure can accumulate. In distributed systems, they are most valuable when they focus on network-level exchanges rather than internal method calls.
They are also the right place to model operationally significant behavior: timeouts, retries, acknowledgments, circuit breakers, duplicate-event handling, and compensating actions. A short sequence for “order accepted → event published → inventory and billing consume independently” can surface idempotency requirements and highlight where eventual consistency is introduced.
Activity diagrams
Activity diagrams are useful when the concern is end-to-end workflow rather than direct service choreography. They work well for long-running business processes that cross services, queues, approvals, and batch steps. Because they emphasize flow, branching, and waiting states, they are often easier for mixed business and technical audiences to follow.
They are particularly effective for discussing eventual consistency, manual intervention points, and parallel processing. A loan-origination workflow, for instance, may involve automated document validation, external credit checks, manual underwriter review, and delayed notification. An activity diagram can show that progression more clearly than a sequence diagram overloaded with participants.
State machine diagrams
State machine diagrams are often underused, yet they are highly relevant in distributed systems. Many hard problems are state problems: order lifecycle, payment status, subscription activation, device provisioning, or incident escalation. A state machine defines valid transitions, triggering events, timeout conditions, and recovery paths.
This becomes especially important in event-driven systems, where several services observe and update the same business entity over time. Without an explicit state model, teams often carry conflicting assumptions about which transitions are valid and which are terminal. That ambiguity eventually surfaces as reconciliation work, support tickets, or brittle compensating logic.
Package diagrams
Package diagrams are less operational, but they remain useful in large enterprises. They help organize the model around domains, bounded contexts, or team ownership. That gives governance functions a way to show which parts of the system are meant to evolve together and where dependency control matters.
Using the diagrams together
The strongest distributed-system models combine these views rather than relying on one. Component diagrams define responsibility. Deployment diagrams show runtime placement. Sequence and activity diagrams explain behavior. State machines clarify lifecycle. Package diagrams provide organizational structure. Used together, they create a balanced picture of architecture as designed, executed, and operated.
Representing Services, APIs, and Communication Patterns
Once the core views are established, the next step is to represent how services actually participate in the system. A distributed-system model is useful only if it does more than list services. It needs to show what each service owns, how its capabilities are exposed, and what communication style governs each relationship.
Modeling services as responsibilities plus contracts
A service should not be shown only as a deployable unit. It should also be modeled through the contracts by which it interacts with the rest of the estate. Many enterprise services play several roles at once: exposing synchronous APIs, publishing events, consuming commands, and depending on shared identity or observability platforms. If those roles are blended together, the model becomes harder to read and governance becomes harder to apply.
A practical component diagram should distinguish:
- the service as a responsibility boundary,
- the interfaces it provides,
- the interfaces it requires.
That separation makes it easier to spot over-coupling. A customer profile service that appears simple may, when modeled properly, turn out to depend on a CRM API, a consent service, a shared cache, and a central token introspection endpoint. That is a very different architectural picture from a single box labeled “Customer Service.”
Modeling APIs as architectural contracts
APIs are best modeled as business-facing contracts rather than transport-specific endpoints. Names such as “Order Submission API,” “Customer Profile Query API,” or “Policy Decision API” communicate purpose more clearly than URL paths or topic names alone. Transport details—REST, gRPC, GraphQL, event topic, command queue—can be added as annotations, but they should support the architectural meaning rather than dominate it.
That approach keeps the model aligned with capability and ownership. It also allows multiple technical exposures of the same logical capability to be shown without losing business context. A pricing capability might expose a synchronous quote API for checkout and publish asynchronous price-change events for catalog consumers. Those are different interfaces serving the same bounded responsibility.
Making communication style explicit
In distributed systems, a line between two components says too little. The model should make clear whether the interaction is:
- synchronous request-response,
- asynchronous event publication,
- queued command processing,
- stream-based delivery.
Communication style has direct architectural consequences. Synchronous calls increase temporal coupling and can create latency chains. Asynchronous messaging improves decoupling and resilience, but it introduces eventual consistency, ordering concerns, duplicate delivery, and idempotency requirements. Queues can absorb spikes and isolate workloads, yet they can also conceal backlog risk if they are not modeled explicitly.
A realistic example is claims processing in insurance. A “Submit Claim” API may synchronously validate policy coverage because the customer needs an immediate response, while fraud analysis and document classification proceed asynchronously after the claim is accepted. If both interactions are shown simply as arrows between services, the architecture hides the difference between customer-critical latency and deferred processing.
Representing mediation layers
Gateways, service meshes, integration platforms, and event brokers should be modeled explicitly when they materially affect the architecture. These are not background plumbing. They shape security, throttling, transformation, observability, and policy enforcement.
If they are omitted, the design often appears cleaner than it is. Including them helps answer practical questions: where authentication is validated, where traffic policy is applied, whether business services are tightly coupled to mediation technology, and how cross-domain interactions are controlled.
For example, in a partner integration platform, an API gateway may terminate mutual TLS, apply rate limits, and inject correlation IDs before routing traffic to internal services. That behavior belongs in the model because it affects both security posture and operational troubleshooting.
Modeling operational behavior, not just nominal flow
Communication models should include details with operational significance. For service interactions, that often means showing:
- correlation identifiers,
- timeout ownership,
- retry ownership,
- dead-letter handling,
- compensating actions,
- duplicate-event handling.
These details are frequently where support problems emerge. A sequence diagram that shows both caller and callee retrying the same operation can reveal load amplification before it happens in production. A message flow that includes a dead-letter queue and manual replay path makes support ownership clearer than prose alone.
Practical modeling guidance
For most distributed systems, the objective is not to document every operation. It is to expose the communication decisions that affect scalability, resilience, and changeability. A useful UML model should make clear:
- which interactions are contract-driven,
- which are event-driven,
- which require immediate consistency,
- which tolerate delay,
- where mediation or policy enforcement occurs.
If those points are visible, teams can assess service boundaries and integration risk with far more confidence.
Modeling Deployment, Infrastructure, and Runtime Topology
Logical architecture tells only part of the story. In distributed systems, many of the most serious risks come from runtime realization. Services that appear independent in a component diagram may still share infrastructure, network paths, control planes, or stateful dependencies. That is why deployment modeling deserves more attention than it often receives.
Extending the deployment view beyond servers
Modern deployment diagrams should represent more than servers and virtual machines. Enterprise runtime topology often includes:
- Kubernetes clusters and namespaces,
- container platforms,
- serverless functions,
- API gateways,
- service meshes,
- managed databases,
- message brokers,
- CDN or edge services,
- identity providers,
- observability platforms.
UML deployment diagrams can represent these as nodes and execution environments, with deployed artifacts mapped onto them. The objective is simple: show where software runs and what platforms it depends on.
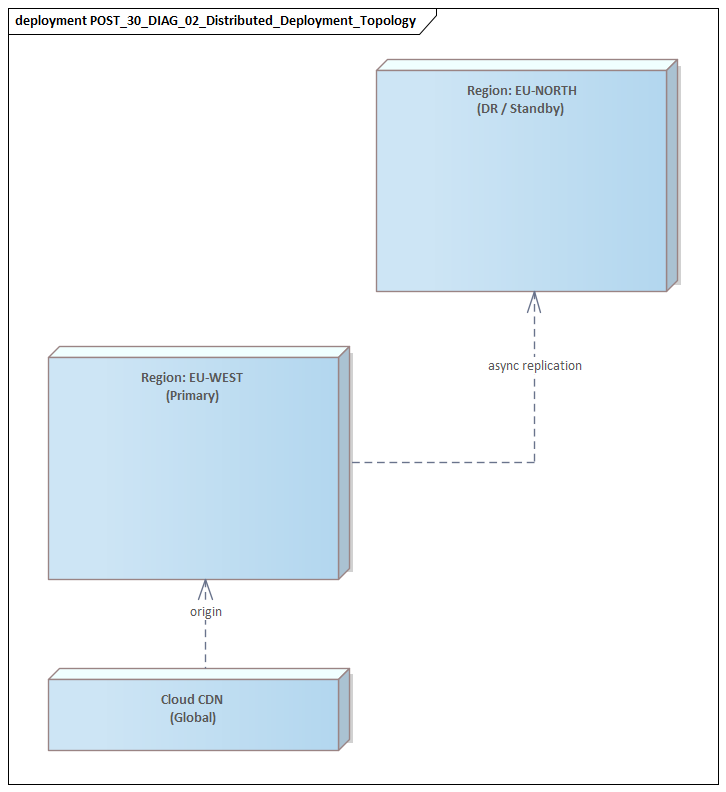
Making failure domains visible
One of the most important uses of deployment modeling is to expose failure domains. Logical separation does not guarantee resilience. Architects should distinguish:
- regions,
- availability zones,
- cloud accounts or subscriptions,
- virtual networks,
- on-premises segments,
- shared control-plane dependencies.
A deployment diagram that places all critical services in one cluster, one broker, or one region immediately reveals resilience limits. In the same way, a design that appears multi-region at the application layer may still depend on a single identity tenant or centralized secret store. Weaknesses like these often remain hidden until runtime topology is modeled directly.
A practical micro-example: a healthcare scheduling platform deploys booking services in two regions for high availability. The deployment diagram shows both regions relying on one centralized FHIR integration gateway hosted on-premises. The application looks resilient; the integration dependency does not.
Representing trust and network boundaries
Security architecture shapes runtime topology as much as application design does. Enterprise systems commonly span internet-facing zones, private networks, partner connectivity segments, and regulated environments. Deployment diagrams should therefore show trust and network boundaries clearly.
Useful annotations may include:
- ingress and egress points,
- protocol and encryption requirements,
- trust transitions,
- private versus public connectivity,
- policy enforcement locations.
This helps reviewers assess whether sensitive data crosses boundaries unnecessarily, whether east-west traffic depends on centralized controls, and where security assumptions actually reside.
Showing stateful infrastructure
Distributed systems often look stateless at the service layer while depending heavily on stateful infrastructure. Databases, caches, object stores, and brokers define many of the real operational constraints. Deployment models should show:
- which services share a database,
- where replication occurs,
- whether caches are local or distributed,
- how messaging infrastructure is partitioned or shared,
- where data residency constraints apply.
This is critical for understanding contention, blast radius, and recovery complexity. Shared state creates hidden coupling even when services are logically well separated. A customer billing service and notification service may seem unrelated until the deployment view shows both depend on the same Redis cluster for workflow state and rate-limit coordination.
Including control-plane and operational flows
Runtime topology should also include important operational dependencies, not just customer transaction paths. These can include:
- health checks,
- metrics export,
- log shipping,
- secret retrieval,
- configuration pulls,
- deployment agents,
- backup and restore paths.
In segmented or regulated environments, these control flows may matter as much as business traffic. Modeling them can reveal whether observability requires cross-zone access, whether deployment tooling has privileged reach into restricted workloads, or whether recovery depends on network routes that may be unavailable during incidents.
Questions the deployment model should answer
A strong deployment view should support practical analysis. It should make it easier to answer:
- What fails together?
- What scales independently?
- What crosses a trust boundary?
- What depends on shared infrastructure?
- What must be recovered first?
When a deployment diagram answers those questions, it stops being a static picture and becomes a tool for resilience review, security assessment, migration planning, and operational design.
Capturing Scalability, Resilience, and Failure Scenarios
A distributed-system model is incomplete if it shows only nominal behavior. Enterprise architectures are judged by what happens under growth, partial outage, degraded performance, and recovery. UML is useful here because it can turn non-functional concerns into explicit architectural behavior instead of leaving them as vague statements in a requirements section. fixing Sparx EA performance problems
Modeling scalability as an architectural property
Scalability should not be treated as a generic promise of the platform. Different parts of a distributed system scale in different ways. Stateless API services may scale horizontally with little friction, while workflow engines, partitioned consumers, databases, or caches may introduce harder limits.
Deployment diagrams can show replication, autoscaling groups, partition ownership, and read/write separation. Component diagrams can show which services scale independently and which remain tied to shared state or centralized coordination. That makes bottlenecks visible earlier.
Modeling load-related behavior
Behavioral diagrams are useful for showing what happens when load changes. Sequence diagrams can represent throttling, buffering, fallback responses, or degraded-read behavior. Activity diagrams can show how work is deferred when downstream capacity is exhausted or how optional steps are skipped to protect core transaction throughput.
Enterprise systems rarely fail through total outage alone. More often, they degrade through queue buildup, timeout amplification, thread exhaustion, or stale-cache dependence. Modeling those paths supports graceful degradation rather than a simplistic success/failure view.
A realistic example comes from e-commerce during peak events. Checkout may remain available while recommendation, loyalty lookup, and promotional personalization are temporarily bypassed. A sequence diagram that shows those optional branches being short-circuited under load is much more useful than an architecture principle stating “the platform degrades gracefully.”
Distinguishing types of failure
Resilience modeling should distinguish between different failure categories:
- service-instance failure,
- dependency failure,
- control-plane failure.
These are architecturally different. A service crash may be absorbed through redundancy. A database outage may force read-only behavior or suspend a business capability. A failure in DNS, identity, secret storage, or service discovery can disable many otherwise healthy services at once.
This is where deployment and sequence perspectives need to align. Severe incidents often begin in shared platform services that application-only diagrams leave out.
Modeling exception and alternate flows
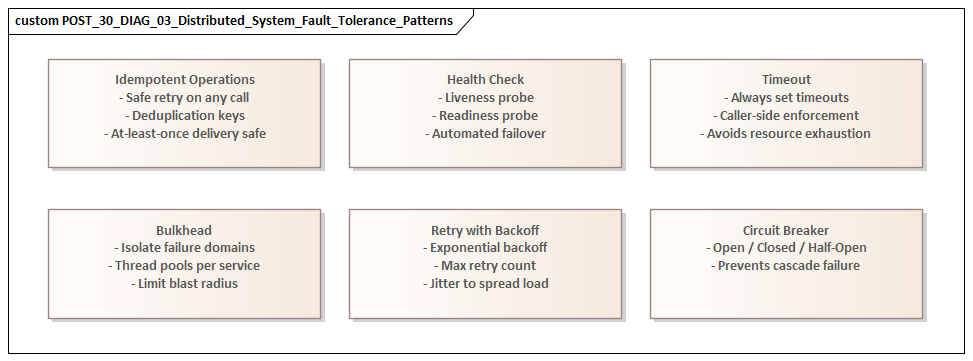
Failure scenarios should be represented explicitly, especially in sequence diagrams and state machines. Useful patterns include:
- timeout branches,
- retry limits,
- circuit-breaker activation,
- dead-letter routing,
- duplicate-event handling,
- compensating transactions,
- suspended or manually reconciled states.
This is particularly important in event-driven and long-running workflows, where failure is often a divergence in state across components over time rather than a single visible crash.
A subscription provisioning example illustrates the point. A telecom order may pass credit check, reserve a number, and initiate SIM activation. If SIM activation fails after billing has started, the system needs a compensating path: suspend billing, release inventory, and place the order in a “manual review” state. That scenario is far easier to reason about with a state machine and sequence diagram than with prose.
Capturing recovery assumptions
Resilience is not only about surviving failure; it is also about returning to a valid operating state. Models should therefore show whether recovery is:
- automatic,
- dependent on replay from durable logs,
- dependent on data re-synchronization,
- dependent on operator approval or manual intervention.
These assumptions directly affect recovery time objectives, support procedures, and business continuity planning. Yet they are often left out of design documentation because they sit awkwardly between application design and operations.
Focusing on decision-relevant scenarios
The aim is not to diagram every possible fault. It is to model the failures that would change architecture decisions. Examples include:
- regional loss,
- broker saturation,
- identity-provider unavailability,
- poison messages,
- cache inconsistency,
- downstream latency spikes.
When these scenarios are made explicit, resilience becomes a set of testable architectural behaviors rather than a generic quality attribute.
Governance, Documentation Practices, and Common Modeling Pitfalls
For UML to remain useful in enterprise distributed systems, it has to be treated as an architecture asset rather than a one-time illustration. Distributed systems evolve constantly: services split, dependencies shift, platforms change, and security controls move. Without governance, diagrams quickly become decorative and lose credibility.
Define required views by change type
A practical governance model starts by defining which UML views are required for which kinds of change. For example:
- a new cross-domain integration may require a component and sequence diagram,
- a move to multi-region deployment may require updated deployment and state views,
- a major workflow redesign may require activity and sequence diagrams.
This keeps documentation proportional to architectural risk. The real question is not whether a diagram exists. It is whether the model exposes the decisions and risks introduced by the change.
Assign explicit ownership
No single team usually understands every dependency in a distributed system well enough to maintain all diagrams. A federated ownership model works better:
- domain teams maintain logical and behavioral views for their services,
- platform or enterprise architecture teams maintain shared deployment and governance views.
That reflects how systems are actually built and reduces the risk of a central repository becoming stale.
Link models to decisions and evidence
Diagrams should not stand alone. They should connect to:
- architecture decision records,
- API specifications,
- resilience requirements,
- data-classification rules,
- implementation repositories,
- infrastructure definitions where relevant.
This creates traceability between intent and realization. It is especially useful during audits, incident reviews, and modernization planning. A deployment diagram linked to an ADR and a lifecycle plan, for example, gives an architecture board something concrete to review when approving the retirement of an unsupported integration broker.
Maintain deliberate abstraction levels
One of the most common modeling mistakes is mixing strategic, logical, and runtime detail in a single view. When one diagram tries to show domain boundaries, message flows, Kubernetes objects, security zones, and team ownership all at once, clarity disappears.
Each diagram should answer a specific question:
- component diagrams for responsibility and dependency,
- deployment diagrams for runtime placement and shared infrastructure,
- sequence diagrams for interaction behavior and failure handling,
- activity diagrams for workflow,
- state machines for lifecycle.
Common pitfalls
Several recurring issues reduce the value of UML models in distributed systems.
False completeness
Polished diagrams that omit identity, secrets, observability, external providers, or shared data platforms.
Static bias
Structure is modeled, but timing, failure ownership, and lifecycle behavior are ignored.
Tool-driven distortion
The architecture is represented according to what the tool supports easily rather than what stakeholders need to understand.
Compliance-only modeling
Diagrams are created for approval gates and then abandoned.
Keep models alive in delivery and operations
The best way to avoid those pitfalls is to embed modeling into normal delivery and operational practice. Update key diagrams during significant design changes. Revisit them after incidents. Use them in onboarding, dependency reviews, migration planning, and recovery exercises. Architecture boards are usually better served by a current component and deployment view than by a large but stale repository.
The most useful UML models are rarely the most detailed. They are the ones teams still trust when making consequential decisions.
Conclusion
Modeling distributed systems with UML works when it removes ambiguity from decisions with real technical and organizational consequences. Its value does not come from formal completeness. It comes from making architectural intent visible: where autonomy is real, where coupling remains hidden, where runtime assumptions are fragile, and where governance needs to intervene.
UML is most effective when used through a small set of complementary views. Component diagrams clarify service responsibilities and contracts. Sequence and activity diagrams show how interactions and workflows behave across distributed boundaries. Deployment diagrams reveal runtime topology, trust boundaries, and shared failure domains. State machine diagrams make lifecycle rules explicit where event-driven and long-running processes might otherwise become ambiguous. Together, these views connect logical design to operational reality.
That connection is what gives UML lasting value in enterprise environments. Distributed systems are not difficult simply because they involve many services. They are difficult because complexity is spread across teams, platforms, dependencies, and time. A practical UML model helps organizations reason across those dimensions. It supports design review, resilience analysis, security assessment, modernization planning, and incident learning in ways ad hoc diagrams rarely can.
UML should not replace engineering artifacts such as code, infrastructure definitions, service catalogs, or observability data. It complements them by expressing what those artifacts often do not: architectural intent, design rationale, and critical boundaries. In that role, UML becomes less a documentation exercise and more a decision framework.
As distributed architectures continue to expand across cloud platforms, data domains, and organizational boundaries, the need for disciplined modeling is unlikely to fade. UML remains relevant because, used selectively and maintained responsibly, it brings coherence to that complexity. Model the decisions that matter. Keep each view tied to a clear question. Ensure diagrams stay connected to real system change. Done well, UML turns distributed-system architecture from a collection of assumptions into something that can be reviewed, challenged, and trusted.
Frequently Asked Questions
What UML diagram types are most useful for enterprise architects?
For enterprise architecture: Component diagrams (application structure and interfaces), Deployment diagrams (infrastructure topology), Sequence diagrams (runtime interactions), Class diagrams (domain models and data structures), and Use Case diagrams (functional scope). Each serves a different audience and purpose.
What are the most common UML modeling mistakes?
Common mistakes include: using the wrong diagram type for the audience, mixing abstraction levels in a single diagram, over-specifying implementation detail in structural diagrams, omitting multiplicities and relationship types, and creating diagrams that are not navigable or meaningful outside their original context.
How does UML relate to ArchiMate in enterprise architecture?
UML and ArchiMate are complementary. ArchiMate is used for enterprise-wide architecture across business, application, and technology layers. UML is used for software design — class structures, sequences, components, and deployments within a single application or domain. In Sparx EA, both notations coexist in the same repository.