⏱ 24 min read
ArchiMate Technology Architecture Diagram Example | Layers, Elements & Best Practices ArchiMate training
Explore an ArchiMate technology architecture diagram example and learn how to model infrastructure, platforms, networks, and technology services using ArchiMate best practices. ArchiMate tutorial for enterprise architects
ArchiMate technology architecture diagram example, ArchiMate technology layer, technology architecture diagram, ArchiMate infrastructure modeling, ArchiMate technology services, ArchiMate nodes devices system software, enterprise architecture diagram, ArchiMate example, ArchiMate best practices, technology architecture modeling ArchiMate layers explained
Introduction
An ArchiMate Technology Architecture Diagram shows the technology foundation that supports applications and, in turn, business capabilities. Strategy discussions often focus on business and application architecture, but delivery depends just as heavily on the quality of the underlying technology estate: compute platforms, networks, middleware, identity services, storage, and operational tooling. A technology architecture view brings those elements into one coherent picture by describing them in a consistent modeling language. ArchiMate relationship types
That clarity matters because enterprise technology estates are rarely tidy. Most organizations operate a mix of on-premises infrastructure, cloud services, shared platforms, security zones, and legacy environments accumulated over time. Documentation usually sits in separate team silos—network, infrastructure, cloud, security, operations—each using its own terminology and level of detail. ArchiMate helps unify those perspectives. Instead of producing another isolated infrastructure sketch, it creates a model that shows which technology elements exist, how they relate, where workloads are deployed, and which services the technology layer provides. ArchiMate modeling best practices
The practical value is broader than documentation. A well-constructed technology diagram supports standardization, rationalization, impact analysis, and roadmap planning. It can reveal duplicated hosting patterns, unsupported platforms that introduce operational risk, or hidden dependencies between shared services and critical applications. It is equally useful when evaluating change. Whether an enterprise is introducing container platforms, modernizing IAM, adopting Kafka for event streaming, or tightening technology lifecycle governance, a clear view of current and target states improves the quality of decisions.
It also helps different stakeholders work from the same architectural baseline. Platform engineers may care about nodes, system software, and deployment relationships. Portfolio, risk, and governance stakeholders are more likely to focus on resilience, concentration risk, cost, and strategic platform direction. The same model can support both conversations. An architecture board, for instance, may use a technology view to decide whether a proposed solution should run on the approved container platform and enterprise IAM service instead of introducing another bespoke runtime. ArchiMate allows that shift in audience without forcing a shift in architectural logic.
This article uses a practical enterprise scenario to show how an ArchiMate Technology Architecture Diagram can represent a modern platform landscape. The goal is not only to explain the notation, but to show how the technology layer can be modeled in a way that supports governance, delivery, and planning. The most useful diagram is not the one with the most boxes. It is the one that makes dependencies and decisions visible: where applications run, which shared services they rely on, how environments are segmented, and where modernization effort will have the greatest effect.
What an ArchiMate Technology Architecture Diagram Is
An ArchiMate Technology Architecture Diagram is a viewpoint used to represent the infrastructure and platform layer of the enterprise through the ArchiMate modeling language. Its purpose is to show how technology elements are organized and how they work together to provide the execution environment for applications and digital services.
In practical terms, it answers a straightforward question: what technology is required to host, connect, secure, and operate the application landscape? In ArchiMate, that usually means modeling elements such as Node, Device, System Software, Technology Service, Technology Interface, Path, Communication Network, and Artifact. These concepts allow architects to describe infrastructure with more precision than a generic server-and-network diagram. Rather than drawing a single “application server” box, the model can distinguish the compute environment, the software platform installed on it, the deployable artifacts running there, and the technology services exposed to consumers.
The real strength of the diagram lies in the relationships between those elements. It does not simply list assets. It shows the dependency structure that sits underneath applications and services. A technology service may be realized by system software, hosted on a node, connected through a network path, and consumed by application components. That relational view is what makes the diagram useful for analysis. It allows architects to trace how critical applications depend on identity platforms, database services, storage, integration middleware, event platforms such as Kafka, or hybrid connectivity.
It is also worth being clear about what this diagram is not. It is not automatically a low-level engineering blueprint, a rack layout, or a complete operational topology. The architect chooses the level of abstraction according to the decision being supported. Sometimes it is enough to show major hosting domains and shared platform services. In other cases, trust zones, load balancers, clusters, event brokers, and storage tiers need to be visible because they materially affect resilience, security, or cost.
A good technology architecture diagram sits in the middle ground. It is more analytical than detailed infrastructure documentation, but more concrete than a purely strategic architecture view. That is where it earns its place. It is detailed enough to support reasoning about deployment, availability, standardization, and technical risk, while still remaining readable for governance forums and roadmap discussions.
Core Technology Layer Elements and Relationships
The technology layer becomes useful when its elements are modeled consistently and connected in ways that reflect real platform dependencies. This section introduces the core concepts used later in the example diagram and pattern discussion.
Node
A Node represents a computational resource on which behavior can be executed or artifacts can be deployed. In practice, it might be a virtual machine, a cloud compute instance, a container host, or a clustered runtime environment. Nodes often form the structural anchors of a technology view because they show where workloads actually run.
Device
A Device is a specialized type of node that represents physical hardware. Examples include storage appliances, network hardware, physical servers, or edge devices. Device-level modeling is useful when the physical aspect matters architecturally, such as for resilience, site dependency, operational ownership, or hardware lifecycle planning.
System Software
System Software represents the software environment that allows workloads and services to run. This includes operating systems, database engines, container runtimes, middleware, web servers, identity platforms, and event brokers. Modeling system software explicitly is often valuable because many platform standardization decisions are made at this level. An enterprise may support a broad application estate while still standardizing tightly on runtimes, databases, middleware, messaging platforms, or identity products.
Technology Service
A Technology Service captures the externally visible functionality provided by the technology layer. This is one of the most important concepts in the model because it shifts attention from components to capabilities. Examples include compute hosting, database hosting, messaging, event streaming, identity and access, storage, monitoring, and network connectivity. A technology view becomes far more useful when it shows what the estate provides, not just what it contains.
Technology Interface
A Technology Interface represents a defined point of access to a technology service. It might describe an API gateway endpoint, a database listener, a Kafka bootstrap endpoint, an identity federation endpoint, a network endpoint, or a management console. Interfaces are especially useful when responsibility boundaries or access constraints need to be made explicit.
Path and Communication Network
A Path models a link between nodes, while a Communication Network represents the network structure that enables communication. These elements matter when security zoning, hybrid connectivity, latency, or environment isolation influence architecture decisions.
Artifact
An Artifact represents a deployable asset such as an application package, script, configuration bundle, or container image. Artifacts become particularly relevant when deployment traceability matters, as it often does in automated delivery environments.
Relationships That Make the Model Useful
The element types matter, but the relationships between them are what make the diagram architecturally meaningful. Common relationships include:
- Assignment: links behavior or responsibility to a structural element
- Realization: shows that one element implements or delivers another
- Deployment: shows that an artifact is deployed onto a node
- Serving: shows that one element provides functionality to another
- Association: expresses a meaningful connection when a more specific relationship is not appropriate
Together, these relationships create the dependency chain that makes the technology layer analyzable. A node may host system software; that system software may realize a technology service; an artifact may be deployed on the node; and the resulting service may serve an application component. That chain is what allows architects to assess impact, identify concentration risk, compare target-state options, and expose hidden dependencies that would remain invisible in a simple infrastructure drawing.
A short example makes this concrete. A customer portal might be deployed as a container image artifact onto a managed Kubernetes node group. The cluster runs container orchestration system software, which realizes a container hosting technology service. That service, in turn, serves the portal application component. If the board later asks whether the portal can move regions for resilience reasons, the model already shows the hosting dependency that must be addressed.
How to Read and Interpret a Technology Architecture Diagram
Once the core elements are clear, the next step is learning how to interpret the diagram in a structured way. The most useful approach is to read it in layers rather than as one dense technical picture.
1. Start with Scope and Purpose
First, determine what the view is meant to show. Is it a current-state production landscape, a target-state platform architecture, a transition architecture, or a focused view of a specific domain such as identity or cloud hosting? ArchiMate diagrams are selective abstractions. The same technology estate may be modeled differently depending on whether the goal is migration planning, resilience analysis, or platform standardization.
2. Identify the Structural Anchors
Next, locate the major hosting domains, platform clusters, network zones, or shared infrastructure areas around which the diagram is organized. These are often the primary nodes, devices, or grouped structures. In practice, these anchors reveal how the estate is partitioned: on-premises versus cloud, production versus non-production, internal versus external exposure, or primary versus disaster recovery.
3. Read Through the Service Lens
Once the structural layout is clear, shift attention from hardware inventory to technology services. Ask what capabilities the technology layer is providing and which platforms realize them. This is where standardization opportunities and shared-service dependencies become visible. If several platforms provide the same service in slightly different ways, the estate may be carrying unnecessary complexity. If one shared service supports many critical workloads, it may represent concentration risk.
A familiar example is IAM modernization. An architecture diagram may show customer authentication for dozens of applications still depending on a single legacy directory and federation stack. What looked like an infrastructure detail then becomes an enterprise issue. In one review, a board may decide that no new customer-facing solution can onboard directly to the legacy federation platform; all new workloads must integrate with the strategic cloud IAM service, with coexistence handled through temporary federation.
4. Follow Dependency Paths
From there, trace relationships from consumers to providers. This is where the diagram starts to answer operational and planning questions. Follow a service or application downward into the nodes, system software, interfaces, and network paths that support it. The exercise often reveals impact areas that are not obvious from the application layer alone. A service that appears resilient may still depend on a single identity platform, Kafka cluster, database engine, or network route.
5. Look for Patterns and Exceptions
Strong diagrams reveal repeated platform patterns. Consistent environment segmentation, recurring middleware stacks, or standard deployment structures usually indicate approved architecture patterns. One-off designs often signal technical debt, local exceptions, or unmanaged solution sprawl. Experienced architects look for these deviations quickly because they often determine the governance conversation.
For example, if most digital products publish business events to a shared Kafka platform but one new project proposes a dedicated point-to-point message broker, the board can see immediately that the proposal breaks the standard event pattern. The question then becomes whether there is a genuine non-functional need or simply a local design preference.
6. Ask What Decisions the View Supports
Finally, judge the diagram by the questions it can answer. Can it support cloud migration planning? Does it clarify resilience dependencies? Can it show where platform ownership sits or where modernization effort should focus? Can it support lifecycle decisions, such as retiring an unsupported database version within the next 18 months? A diagram is successful not because the notation is correct, but because it helps people make better architecture decisions.
Example Enterprise Scenario and Diagram Walkthrough
To make the technology layer more concrete, consider a mid-sized enterprise operating a customer-facing digital platform alongside internal business systems. The organization has grown through acquisition, so its estate includes both legacy on-premises infrastructure and newer cloud platforms. Its objective is not an immediate full cloud migration, but a controlled hybrid model that improves resilience, reduces complexity, and creates a manageable path for modernization.
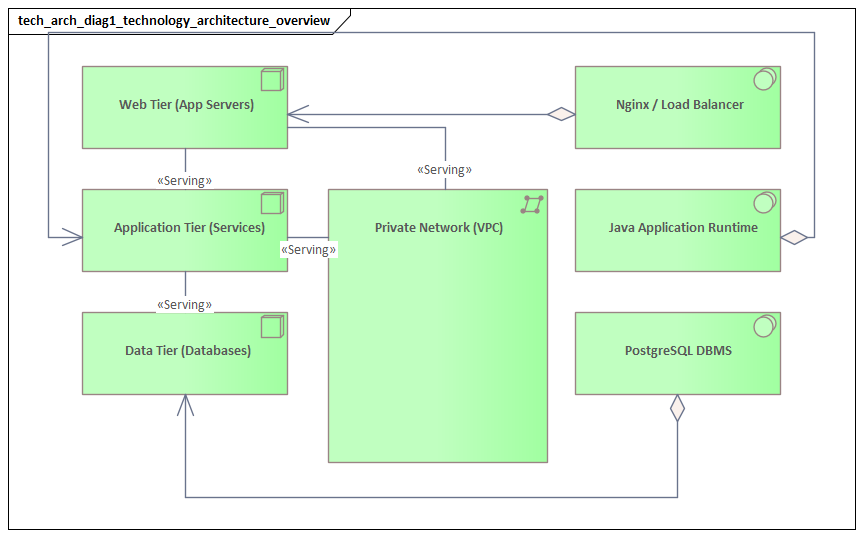
The diagram can be understood through three main structural anchors: an on-premises data center, a public cloud platform, and a shared corporate network and security zone connecting them. That immediately signals a hybrid estate. Many architecture decisions in such environments are driven less by application logic than by connectivity, trust boundaries, and operational ownership across those domains.
On-Premises Domain
Within the on-premises domain, the diagram might show:
- a virtual server cluster as a node
- a database platform as system software deployed on dedicated or virtual infrastructure
- an internal integration platform providing messaging or orchestration services
- a legacy IAM platform providing directory, federation, and administrative authentication services
- storage and backup capabilities represented as technology services
Rather than modeling every server, the view groups infrastructure into meaningful platform units. That keeps the model tied to decisions instead of inventory. In this case, the key insight is that several core business systems still depend on a stable but aging internal platform stack.
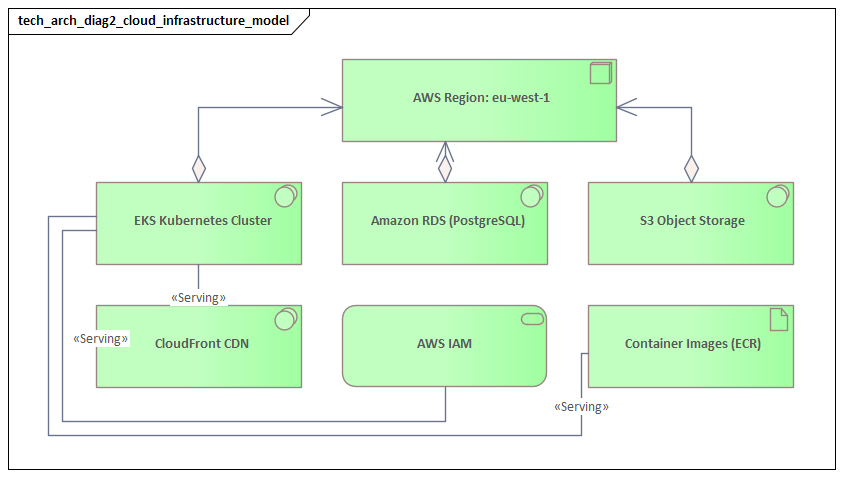
Cloud Domain
The cloud domain may include:
- a managed container platform represented as a node
- managed database services modeled as technology services
- a Kafka-based event streaming platform for asynchronous integration
- object storage and centralized monitoring services
- cloud-native identity and secrets capabilities where relevant
This part of the diagram reflects the enterprise’s preferred operating model for new digital workloads. Compared with the on-premises domain, the cloud view may show fewer internal technology details because responsibility has shifted to the cloud provider. That is an important distinction. Where services are externally managed, the architecture view can emphasize service dependency and governance rather than server composition.
Shared Network and Security Zone
Between the two domains, the communication structure becomes critical. The diagram may show:
- a secure network path linking cloud and on-premises environments
- identity federation as a technology service
- gateway or API mediation capabilities
- segmentation boundaries or trust zones
In hybrid estates, the difficult issues usually sit at these boundaries rather than inside the hosting platforms themselves. Cross-environment communication, authentication, inspection, and failure handling are often where delivery risk accumulates.
Walking the Dependency Chain
Now consider a business-critical digital application hosted on the cloud container platform. It consumes:
- managed database services in the cloud
- centralized identity services for customer authentication
- monitoring and logging services for operations
- the Kafka event platform for publishing customer activity events
- an on-premises integration platform to exchange data with a core system of record
Tracing this chain reveals a common enterprise reality: even modernized front-end services often remain dependent on legacy back-end technology services. This is precisely why the technology architecture view matters. Without it, stakeholders may assume that moving a workload to the cloud is equivalent to modernizing it. The diagram shows otherwise. Hosting may have changed, but identity, integration, eventing, and data dependencies still shape resilience, delivery speed, and migration complexity.
A realistic board-level example illustrates the point. Suppose the digital team proposes to decommission the on-premises web tier after moving the customer portal to the cloud. The technology diagram shows that the portal still authenticates through the legacy federation service and still sends policy updates through the on-premises integration middleware. The board may approve the hosting move, but classify the application as only partially modernized and require a follow-on roadmap for IAM and integration decoupling.
Architectural Insights from the Example
Viewed as a whole, the example diagram reveals several useful insights:
- Shared services create leverage and risk
Identity, integration, Kafka, and monitoring services support multiple workloads. That makes them strong candidates for modernization, but also potential concentration risks.
- Legacy constraints remain visible even in a hybrid target state
The cloud platform may represent the preferred operating model, but back-end dependencies still limit how quickly change can happen.
- Boundary technologies deserve explicit modeling
Network paths, gateways, and federation services are not incidental plumbing. They are often where performance, security, and resilience issues surface first.
- The diagram supports sequencing decisions
If the organization wants to reduce on-premises dependency, it must address IAM and integration dependencies before, or at least alongside, application migration.
Common Modeling Patterns, Best Practices, and Pitfalls
The example above highlights several recurring patterns that are useful across many enterprises. The aim is not to model every environment differently, but to apply a small set of repeatable structures consistently so the diagram remains readable and comparable over time.
Common Modeling Patterns
Environment Segmentation Pattern
Group technology elements by production, non-production, disaster recovery, region, or trust zone rather than mixing everything into a flat view. This makes operational boundaries visible and helps stakeholders assess resilience, lifecycle, and control models more quickly. In the example scenario, separating cloud and on-premises domains immediately clarified the hybrid nature of the estate.
Shared Platform Service Pattern
Model common capabilities such as identity, messaging, database hosting, monitoring, API management, backup, and event streaming as shared technology services serving multiple consumers. This exposes both reuse and concentration risk. It also supports platform-based governance by distinguishing enterprise services from bespoke solution infrastructure.
Hybrid Connectivity Pattern
Represent cloud and on-premises domains as distinct structures linked by explicit network, security, and integration elements. This pattern matters because hybrid complexity often sits at the boundaries between platforms. Making those dependencies visible helps explain latency, inspection points, identity propagation, and migration blockers.
Deployment Traceability Pattern
Where release management or DevOps maturity matters, include artifacts and deployment relationships to show how deployable assets move across runtime environments. This is particularly useful when architecture decisions depend on release automation, environment consistency, or operational traceability.
Technology Lifecycle Pattern
Where platform renewal is a governance concern, annotate major technologies with lifecycle status such as strategic, tolerated, sunset, or retire. A simple example is marking an on-premises database version as sunset and the cloud-managed database service as strategic. That small addition can materially improve governance conversations.
A common use case is architecture board triage. If a proposed solution requests deployment on an application server version already marked retire, the board does not need to reopen the technology standard. The model already shows the approved direction. The discussion can then focus on whether a time-limited exception is warranted and what remediation date should be attached.
Best Practices
Model for the Question Being Asked
Choose the level of detail based on the decision context. For standardization, emphasize approved platforms and runtime stacks. For migration planning, emphasize dependencies and coexistence. For risk review, emphasize shared services, network boundaries, and single points of failure. The same estate may require several different views.
Keep Naming and Abstraction Consistent
Do not mix vendor product names, generic categories, and project-specific labels without a clear reason. Likewise, avoid placing highly detailed infrastructure objects next to broad conceptual platforms unless that contrast is deliberate. Uneven abstraction is one of the most common sources of confusion in architecture documentation.
Show Services, Not Just Components
A technology view becomes far more useful when it shows what the platform provides. Modeling only nodes and software products often turns the diagram into a static inventory. Explicit technology services make the model easier to interpret and more relevant for governance.
Make Shared Dependencies Visible
Identity, storage, observability, integration, event streaming, and network services are often omitted in the name of simplicity. Yet these are frequently the dependencies that matter most in architecture decisions. If they shape resilience, migration, cost, or control, they should appear in the model.
Separate Current, Transitional, and Target States
Do not combine all architecture states into one undifferentiated picture. If legacy structures, temporary coexistence arrangements, and target-state platforms are shown together without distinction, stakeholders may mistake tactical constraints for strategic intent.
Pitfalls to Avoid
Over-Modeling Engineering Detail
A common mistake is to reproduce low-level infrastructure diagrams element by element. The result may be technically accurate, but architecturally unreadable. Technology architecture diagrams should remain selective abstractions.
Under-Modeling Critical Dependencies
The opposite mistake is to simplify so aggressively that the real constraints disappear. If the diagram hides cross-environment identity, storage, event, or network dependencies, it loses much of its value for planning and risk analysis.
Treating the Diagram as a Static Repository Artifact
A technology view should support active decision-making. If it is created once and never used in reviews, roadmaps, or governance, it will quickly become outdated and lose credibility.
Another frequent pitfall is failing to update lifecycle annotations. A platform marked strategic three years ago may now be on a retirement path. If the model is not maintained, governance decisions drift away from reality. In one enterprise, a delivery team selected a middleware product because the architecture repository still showed it as approved, even though procurement had already announced end-of-support remediation. The issue was not notation; it was stale governance metadata.
Using the Diagram for Stakeholder Communication and Roadmapping
The concepts and patterns covered so far become most valuable when the diagram is used as a communication and planning tool. Different stakeholders look at the same technology landscape through different concerns, and the ArchiMate model provides a common reference point.
Communicating Across Stakeholder Groups
Infrastructure engineers usually care about platforms, environments, and operational constraints. Security teams focus on trust boundaries, exposure surfaces, and control points. Portfolio leaders care about investment, supportability, concentration risk, and modernization timing. Delivery teams want to know which technology services are available and what constraints they must design around.
Because the diagram separates structural anchors, services, and dependency paths, each group can read the same model in its own way without losing consistency. Engineers may focus on nodes and system software; security teams on paths and interfaces; portfolio stakeholders on shared services and platform clusters.
Supporting Architecture Reviews
In architecture review settings, the diagram helps explain why a solution should align with a particular hosting pattern, why a legacy platform creates delivery risk, or why a shared technology service has become strategically significant. That shifts the discussion away from isolated infrastructure choices and toward more useful questions:
- Which enterprise services does the solution depend on?
- Does it follow approved platform patterns?
- Where are the resilience or control weaknesses?
- What transitional dependencies must be accepted?
A typical architecture board decision might be to require a new customer platform to use the enterprise IAM service and Kafka event backbone, while granting a time-limited exception for one legacy integration that still depends on on-premises middleware. In practice, this kind of decision is easier to defend when the technology view shows both the strategic pattern and the transitional dependency in the same architectural context.
Enabling Better Roadmaps
Roadmaps are not simply timelines of projects; they are sequences of constrained changes. Technology architecture diagrams make those constraints visible. If the enterprise wants to reduce reliance on the on-premises data center, the roadmap cannot begin and end with application migration. It must also address identity federation, integration dependencies, network connectivity, event platform adoption, and, in many cases, data platform modernization.
This is where the earlier concepts become especially useful. The shared platform service pattern helps identify enabling platforms that should be modernized first. The hybrid connectivity pattern highlights dependencies that may force temporary coexistence. The dependency paths show which changes are technically possible and which are operationally realistic.
Strengthening Investment Discussions
Technology investments such as IAM modernization, observability uplift, Kafka platform enablement, network redesign, or platform standardization are often difficult to justify because they do not map neatly to a single business feature. A well-structured technology architecture diagram makes those investments easier to explain. When stakeholders can see that many critical services depend on a single aging identity platform, an unsupported middleware stack, or fragmented event tooling, enabling work becomes easier to prioritize and fund.
Consider Kafka adoption as an example. Without a technology view, the investment may look like another integration platform request. With the diagram, the case becomes clearer: multiple digital products need asynchronous event distribution, audit events must be retained centrally, and several teams are currently building custom point-to-point integrations. The architecture board can then position Kafka not as optional tooling, but as a shared event service that reduces duplication and supports future decoupling.
Improving Governance
The diagram also supports governance by creating a stable reference point for standards and exceptions. If a project proposes a bespoke hosting stack where a shared service already exists, the model makes that deviation visible. If a target-state roadmap depends on retiring a platform, the diagram helps track which consumers still remain. This is particularly useful in technology lifecycle governance: identifying all applications still dependent on a database version marked for retirement or an IAM product approaching end of support.
In that sense, the model supports more than communication. It supports disciplined technology decision-making. The value is not in the notation alone, but in the fact that the notation creates a durable, reviewable representation of platform intent, dependency, and constraint.
Conclusion
An ArchiMate Technology Architecture Diagram is most valuable when it becomes a working architecture asset rather than a static picture. Its strength lies in making technology relationships visible: where workloads run, which services support them, how environments are segmented, and where dependencies constrain change.
As this article has shown, the diagram is most effective when built around a few principles. Model relationships and services, not just infrastructure inventory. Choose abstraction deliberately so the view remains readable and decision-relevant. Use consistent patterns for environments, shared services, and hybrid boundaries. Then use the model actively in communication, governance, and roadmap planning.
The example scenario shows why this matters. A hybrid enterprise may appear to be modernizing quickly at the application layer, yet the technology architecture view exposes the deeper dependency chains across IAM, integration, event streaming, data, and network services. Those dependencies determine the real pace of change.
Used well, this ArchiMate view connects strategic intent with implementation constraints. It supports standardization, exposes concentration risk, clarifies transitional architecture, and gives modernization roadmaps more credibility. That is its practical value: not simply documenting the technology estate, but helping the enterprise make better platform decisions with clearer evidence.
Frequently Asked Questions
What is enterprise architecture?
Enterprise architecture is a discipline that aligns an organisation's strategy, business operations, information systems, and technology infrastructure. It provides a structured framework for understanding how an enterprise works today, where it needs to go, and how to manage the transition.
How is ArchiMate used in enterprise architecture practice?
ArchiMate is used as the standard modeling language in enterprise architecture practice. It enables architects to create consistent, layered models covering business capabilities, application services, data flows, and technology infrastructure — all traceable from strategic goals to implementation.
What tools are used for enterprise architecture modeling?
Common enterprise architecture modeling tools include Sparx Enterprise Architect (Sparx EA), Archi, BiZZdesign Enterprise Studio, LeanIX, and Orbus iServer. Sparx EA is widely used for its ArchiMate, UML, BPMN and SysML support combined with powerful automation and scripting capabilities.