⏱ 20 min read
ArchiMate Enterprise Architecture Landscape Diagram: Guide & Best Practices ArchiMate training
Learn how to create an ArchiMate Enterprise Architecture Landscape Diagram to visualize business, application, and technology layers, align stakeholders, and improve architecture communication. ArchiMate tutorial for enterprise architects
ArchiMate, ArchiMate Enterprise Architecture Landscape Diagram, enterprise architecture landscape, ArchiMate diagram, enterprise architecture modeling, business application technology layers, architecture visualization, TOGAF, architecture communication, enterprise architecture best practices ArchiMate layers explained
Introduction
An ArchiMate Enterprise Architecture Landscape Diagram gives stakeholders a single, high-level view of how an enterprise fits together. Instead of describing one project, one solution, or one domain in isolation, it brings together the core business structure, the supporting applications, the information that connects them, and the technology platforms underneath. The result is an architectural map that helps people see the organization as an integrated system rather than a collection of unrelated initiatives. ArchiMate relationship types
This view becomes especially useful in enterprises shaped by acquisitions, decentralized technology decisions, overlapping transformation programs, or years of local optimization. In such environments, the problem is rarely a complete lack of systems or documentation. More often, the enterprise lacks a shared frame of reference. Leaders know the landscape is complex, but they may not know where that complexity is concentrated, which platforms are genuinely strategic, or how business change depends on application and technology choices. A well-designed landscape diagram closes that gap by making the major architectural relationships visible in one coherent view.
Its value is practical. Executives use it to understand the overall shape of the enterprise. Architects use it to identify dependencies, overlaps, and structural gaps. Portfolio and transformation leaders use it to judge where change will have the greatest impact and where local decisions may create wider consequences. Because ArchiMate provides a standard modeling language, the diagram offers more rigor than an informal sketch while still remaining accessible to non-specialists when it is curated carefully. ArchiMate modeling best practices
A strong landscape diagram does not attempt to show everything. Its purpose is orientation, not exhaustive detail. It highlights the stable, decision-relevant parts of the enterprise: major business capabilities, key applications, shared data domains, integration patterns, and foundational technology services. That level of abstraction makes it useful in architecture communication, investment governance, modernization planning, and enterprise-wide roadmap discussions, where too much detail usually obscures the point.
The landscape also supports practical decision-making. It can reveal where critical capabilities depend on aging systems, where several applications support the same domain, where data is fragmented, or where too much operational reliance rests on a small number of platforms. In one retail organization, for example, an architecture board rejected a proposed store-level workflow tool after the landscape showed the same capability already existed in the enterprise service management platform. In another case, a manufacturer used the diagram to show that order capture, pricing, and shipment scheduling all depended on a single legacy integration hub, turning what had looked like a technical upgrade into an enterprise resilience issue.
For the diagram to remain effective, it has to be curated. ArchiMate offers many element and relationship types, but enterprise landscape views work best when they use only what is needed for clear reasoning. A good diagram is not just technically correct. It is selective, readable, and built to support conversation. Maintained over time, it becomes more than documentation; it becomes a shared reference point for governance, planning, and enterprise decision-making.
Understanding the Enterprise Architecture Landscape Diagram
An ArchiMate Enterprise Architecture Landscape Diagram is best understood as a structural map of the enterprise. It is not a process flow, a solution design, or a detailed infrastructure model. Its role is to show the major building blocks of the organization and the most important relationships between them, so stakeholders can reason about enterprise-wide dependencies and change.
At its core, the landscape answers a small set of questions:
- What are the principal business domains or capabilities?
- Which applications enable them?
- What information is shared across those domains?
- Which technology platforms provide the foundation?
- Where are the main dependencies, concentrations, and gaps?
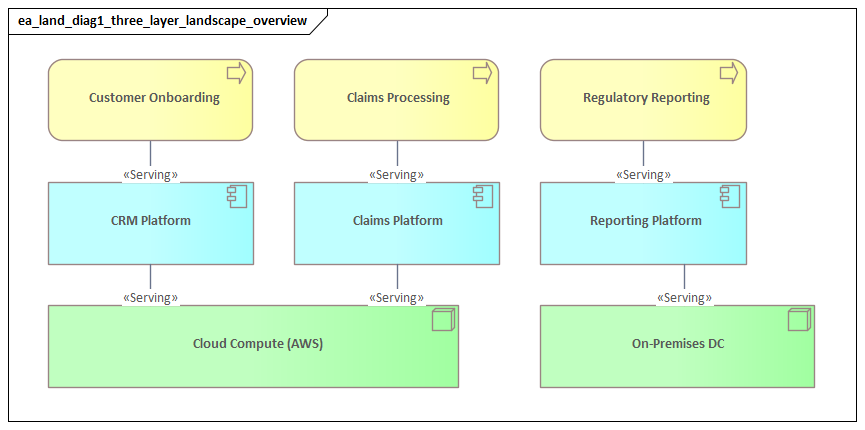
In practice, the diagram usually spans several ArchiMate layers at once. The business layer may include capabilities, functions, services, products, or organizational units. The application layer typically highlights major application components, application services, and integration structures. The technology layer often shows shared platforms, infrastructure services, cloud environments, middleware, networks, or security services. In some cases, strategy or motivation elements are added to frame the view with strategic themes, drivers, or target outcomes.
The value of the landscape does not come simply from placing these elements on one page. It comes from arranging them so that the enterprise becomes intelligible. Stakeholders can see how value is created, how operations are supported, and where architectural significance sits. If several business capabilities depend on one shared platform, that platform is no longer just another application in the portfolio. It becomes an architectural anchor point with high operational and transformation importance. If a business domain is supported by multiple disconnected systems with duplicated data, the diagram exposes a likely source of cost, inconsistency, and delivery friction.
Selective abstraction is what makes the landscape useful. It should show the elements that matter for enterprise decisions and leave detailed treatment to supporting views. In practice, that often means grouping lower-level solution components into broader constructs such as “Customer Platforms,” “Finance Applications,” or “Integration Services.” The landscape provides orientation first; precision can sit elsewhere.
The enterprise landscape also helps distinguish backbone from variation. Most organizations operate with a mix of enterprise-standard services and local or domain-specific solutions. A well-structured view makes that distinction visible. This is especially important in merger integration, ERP transformation, data consolidation, and platform rationalization, where leaders need to know what is standardized, what is duplicated, and what is transitional. A bank integrating an acquired regional lender, for instance, may discover through the landscape that customer onboarding is already standardized, while collections and branch servicing remain fragmented across inherited platforms. That insight changes both sequencing and funding conversations.
In mature architecture practices, the landscape is not a standalone artifact. It acts as an anchor view linked to capability maps, application portfolios, data models, and roadmaps. Those artifacts provide depth. The landscape provides the frame that allows them to be understood together.
Core Layers and Elements
The quality of a landscape diagram depends heavily on the choice of layers and elements. The goal is not to represent the full ArchiMate metamodel, but to assemble a compact set of concepts that shows how the enterprise is structured and where architectural significance lies.
Business layer
The business layer expresses what the enterprise does and how responsibility is organized. Business capabilities are often the most effective anchor because they remain relatively stable even when processes, systems, or organizational structures change. They provide a durable frame for discussing architecture in enterprise terms.
Depending on the purpose of the view, architects may also include:
- Business functions
- Business services
- Products
- Organizational units
- Business actors or roles
The key is consistency. If capabilities are the primary organizing construct, then functions and services should appear only where they add clarity. Mixing too many business abstractions in one view weakens readability and makes cross-layer analysis harder.
Application layer
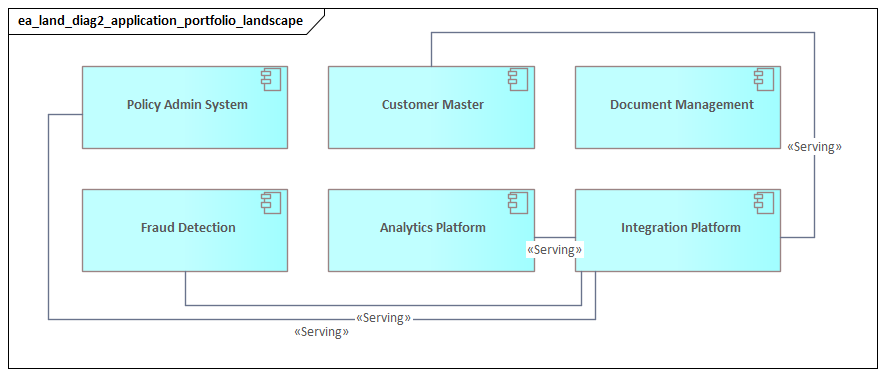
The application layer usually sits at the center of the landscape because it connects business needs to enabling technology. This is where major application components, application services, and key integration structures are shown.
In many enterprises, this layer reveals the most visible architectural issues:
- Overlapping systems
- Fragmented support across domains
- Legacy concentration
- Tight coupling
- Excessive dependence on a few shared applications
Applications should be modeled at the level where governance and investment decisions are made. In a landscape, “CRM Platform” or “Finance Core Systems” is often more useful than listing every module or interface separately. Grouping applications into domains or platform clusters can also make standardization and duplication easier to see.
A realistic example is shared HR technology. One global services firm found that payroll, workforce planning, and employee case management all appeared to be separate local solutions. Once the landscape was assembled, those tools could be grouped into two patterns: a strategic global HR platform and a long tail of regional exceptions. That reframed the discussion from software inventory cleanup to operating model standardization.
Information perspective
Information is essential to a useful landscape, even when it is presented within the business or application layers rather than as a separate layer. Selectively modeled business objects and data objects help show what binds domains together.
Typical examples include:
- Customer
- Product
- Contract
- Asset
- Employee
- Order
Including a small number of key data domains can significantly improve the analytical value of the view. It helps stakeholders see which information is shared, which systems depend on it, and where fragmentation or authority issues may exist. The aim is not to produce a full information architecture, but to provide enough visibility to support enterprise reasoning.
In practice, showing only three or four shared domains is often enough. A utility company, for example, may highlight Customer, Metering Asset, and Service Order. That alone can expose why billing transformation, field service optimization, and customer self-service cannot be treated as independent programs.
Technology layer
The technology layer should focus on foundational platforms rather than infrastructure detail. Common candidates include:
- Cloud environments
- Hosting platforms
- Integration middleware
- Identity and access services
- Security services
- Shared infrastructure services
- Core network or platform services
Here too, the purpose is to show concentration, dependency, and enablement. If multiple critical applications rely on one integration platform or one identity service, that is highly relevant for resilience, modernization, and sequencing decisions. An IAM modernization effort, for example, may reveal dozens of business applications depending on a legacy directory, making identity a cross-enterprise transformation concern rather than merely a security upgrade.
Strategy and motivation elements
In some cases, a limited set of strategy or motivation elements strengthens the landscape. Strategic themes, drivers, or outcomes can explain why the current architecture matters and where change pressure is coming from. These elements should frame the view, not dominate it.
The right element set depends on the decision context. A diagram built for rationalization will emphasize business-to-application mappings and shared data. A diagram built for cloud transformation will make platform dependencies more explicit. A diagram built for operating model alignment may focus on capabilities, ownership boundaries, and enterprise services.
Relationships, Viewpoints, and Cross-Layer Traceability
The analytical value of the landscape comes from relationships. Without them, the diagram is only a categorized inventory. With them, it becomes a model that supports reasoning about impact, risk, ownership, and change.
Relationship discipline
Enterprise landscape views should not use every possible ArchiMate relationship. They work best when they rely on a small number of relationship patterns that can be interpreted consistently across the enterprise. Typical patterns include:
- Business capabilities served by application services
- Applications accessing key data objects
- Application components depending on technology services
- Shared platforms supporting multiple domains
This creates a visual grammar that stakeholders can learn quickly. Too many relationship types may be semantically correct, but they are cognitively expensive.
The choice of relationships should reflect the questions the diagram needs to answer. For example:
- For operational dependency, serving and access may be sufficient.
- For implementation responsibility, assignment and realization may matter more.
- For transformation sequencing, flow or triggering may be useful in limited cases.
Each relationship should justify its presence by making the diagram easier to interpret.
Viewpoint selection
Although the landscape is often presented as a single enterprise view, it is usually built from several underlying viewpoints. A capability-to-application viewpoint may explain functional enablement. An application cooperation viewpoint may reveal integration concentration. A technology usage viewpoint may show hosting or middleware reliance.
The visible landscape should therefore be treated as a synthesis, not as an isolated sketch. The underlying model can carry more rigor and detail; the landscape presents the subset needed for enterprise discussion.
Cross-layer traceability
Cross-layer traceability is what turns the landscape into a governance tool. It allows architects and stakeholders to start with a strategic priority, business capability, or operational issue and follow connected relationships to the applications, data domains, and platforms involved.
That matters because enterprise change rarely stays within one layer. A business initiative such as improving customer onboarding may appear simple at first, but the landscape may reveal dependencies on:
- Customer master data
- CRM capabilities
- Identity services
- Integration middleware
- Analytics platforms
- Shared workflow or case management tools
The landscape does not replace detailed analysis, but it exposes likely scope and dependencies early enough to improve planning.
Traceability also works in reverse. If a platform is being retired, a contract is ending, or a shared service is being migrated, the landscape shows which business capabilities and applications may be affected. This supports portfolio governance, lifecycle planning, and risk assessment. A proposed Kafka platform upgrade, for example, may show dependencies across order processing, customer notifications, and operational analytics, prompting phased rather than big-bang change. Likewise, a data center exit may initially appear to concern only infrastructure teams, yet the landscape may reveal that plant scheduling, warehouse automation, and finance batch processing all rely on the same hosting environment.
To remain useful, traceability has to be governed. Relationships need conventions, ownership, and periodic review. Without that discipline, the landscape may look polished but become operationally unreliable. A mature practice defines which relationships are mandatory, which are optional, and which belong only in lower-level views.
How to Create an Effective Landscape Diagram
Creating an effective landscape diagram begins with purpose. Before selecting elements or arranging layers, architects should define the decision the diagram is meant to support. A view designed for executive communication will differ from one built for application rationalization, merger integration, or cloud migration. Without that design intent, the result is often a generic overview that appears complete but is too unfocused to be useful.
1. Define the purpose
Start by asking:
- What must stakeholders understand?
- What decision will this view support?
- What questions should the diagram help answer?
This step determines the right scope, level of abstraction, and modeling emphasis.
2. Set the scope boundary
Enterprise-level scope can become unmanageable quickly, so define what is in frame and what is not. The diagram may cover:
- The full enterprise
- A business segment
- A geographic operating model
- A transformation domain
- A target-state architecture slice
Granularity should also be agreed early. Capabilities may be shown at level 2, applications at platform level, and technology at shared-service level. This avoids the common problem of mixing strategic abstractions with solution detail.
3. Choose anchor objects
Anchor objects are the elements around which the view is organized. In many cases, business capabilities are the best anchor because they provide stable business context. In other situations, value streams, operating domains, products, or enterprise platforms may work better.
Once the anchors are selected, applications, data domains, and technology services can be attached in a controlled way. That gives the diagram a clear reading path instead of making it look like a flat collection of boxes and lines.
4. Apply controlled abstraction
The landscape should show only what is decision-relevant. That requires aggregation and consolidation. Examples include:
- Grouping tightly related applications into a platform cluster
- Combining several local tools into a non-strategic domain
- Abstracting infrastructure components into a shared cloud environment
- Representing multiple integrations through an integration service or platform
The aim is not to hide complexity, but to present it at the level where enterprise decisions are made. An event-driven estate, for example, is usually clearer when shown as “Enterprise Event Streaming Platform (Kafka)” rather than dozens of topic-level integrations.
5. Design the visual structure
Modeling correctness alone is not enough. Layout should communicate meaning. Good visual structure includes:
- Clustering related elements
- Making shared services visibly cross-cutting
- Highlighting critical dependencies
- Using color consistently
- Reducing line crossings
- Distinguishing current and target elements where needed
Color and grouping should reinforce interpretation, not simply decorate the diagram. One color may indicate enterprise-standard platforms, while another marks local or transitional solutions.
A simple layout choice can materially improve comprehension. If identity, integration, and data platforms sit visibly across the center or bottom of the diagram as shared services, stakeholders immediately understand them as enterprise dependencies rather than domain assets. If those same services are scattered among applications, their architectural significance is easy to miss.
6. Validate with stakeholders
Repository data and application inventories are rarely enough on their own. The landscape should be reviewed with business leaders, domain architects, platform owners, and transformation teams. Those discussions often uncover unofficial dependencies, duplicated capabilities, or operationally critical services that are not obvious from inventory data alone.
Validation also builds trust. Because the landscape can expose duplication, fragmentation, or non-standard solutions, involving stakeholders early reduces defensiveness and improves the quality of the final model.
7. Design for maintenance
A landscape should be maintainable, not just publishable. Define:
- Ownership
- Modeling conventions
- Update triggers
- Review cycles
- Material change criteria
If every revision requires the diagram to be rebuilt manually, it will age quickly. The strongest landscapes are generated from a governed model and refreshed through repeatable practices. This is especially important for technology lifecycle governance, where platforms may move through strategic, tolerated, sunset, and retirement states.
Common Use Cases and Stakeholder Value
The landscape diagram becomes most valuable when it is used as a working instrument in real enterprise situations.
Application and platform rationalization
One of the most common use cases is rationalization. Many organizations know they have too many systems, but they struggle to show which are strategically important, which are duplicated, and which sit on critical business paths. The landscape helps stakeholders evaluate applications in relation to business capabilities, shared data, and enabling platforms instead of debating systems in isolation.
Transformation planning
Transformation programs such as ERP renewal, cloud migration, operating model redesign, and post-merger integration all require a shared structural baseline. The landscape provides that baseline. It helps teams see what is stable, what is transitional, and what must be coordinated across domains. In doing so, it reduces the risk that local optimization will add to enterprise complexity.
Investment governance
Architecture boards, PMOs, and investment committees can use the landscape to assess whether initiatives reinforce enterprise direction or introduce more inconsistency. It helps them ask better questions:
- Does this initiative strengthen a strategic platform or create another silo?
- Does it improve a core capability or duplicate existing support?
- Does it increase dependence on already constrained data or integration services?
That improves the quality of governance discussion, not just visibility. In practice, this may lead to decisions such as mandating reuse of the enterprise IAM service, approving Kafka for asynchronous integration, or declining another departmental reporting platform.
Risk and resilience analysis
Enterprise risk is often structural. A landscape can reveal where many business areas depend on one platform, one data domain, or one shared service. That matters for continuity planning, cyber resilience, vendor risk, and modernization sequencing.
Stakeholder-specific value
Different stakeholders use the same view in different ways:
- Executives gain a simplified picture of enterprise shape, complexity, and standardization.
- Enterprise architects use it to identify structural misalignment and frame target-state discussions.
- Domain architects use it to understand cross-domain dependencies.
- Application and platform owners see how their assets fit into the broader enterprise.
- Transformation leaders and portfolio managers use it to coordinate initiatives and avoid overlap.
The broader value lies in creating a shared reference model for decision-making. In many enterprises, people talk about capabilities, systems, platforms, and data using inconsistent terminology. The landscape provides a common language and a shared frame, which improves alignment and reduces ambiguity.
Common Challenges, Pitfalls, and Best Practices
Landscape diagrams are powerful, but they are also easy to misuse. Several recurring problems reduce their value.
Mistaking completeness for usefulness
A common mistake is to assume that more detail makes the landscape stronger. In practice, excessive completeness usually makes the view harder to read and less useful in governance discussions. The underlying repository can contain depth; the landscape should remain selective.
Best practice: Separate the model from the communicative view. Keep the repository rich, but keep the landscape curated.
Mixing abstraction levels
Another frequent problem is inconsistency in granularity. One part of the diagram may show high-level capabilities while another shows specific products, databases, or environments. This creates conceptual imbalance and weakens comparison.
Best practice: Define abstraction rules in advance and enforce them through review.
Overusing notation
A diagram may be semantically correct but still fail as a decision tool if stakeholders cannot understand it. Too many relationship types, dense crossings, and unstructured placement create cognitive friction.
Best practice: Optimize for interpretability. Use only the relationships and elements needed to support the purpose of the view.
Ignoring political reality
Landscape diagrams are not politically neutral. They expose duplication, local exceptions, shadow IT, weak ownership, and fragmented standards. That can create resistance.
Best practice: Use transparent modeling criteria and involve stakeholders early. Curate the architecture without surprising the organization.
Failing to maintain the diagram
Many organizations create a strong landscape for a strategy exercise or transformation kickoff and then let it age. Once stakeholders notice inaccuracies, trust drops quickly.
Best practice: Tie the landscape to governance processes such as portfolio reviews, project initiation, lifecycle checkpoints, and periodic architecture assessments.
Treating the diagram as a deliverable instead of a decision lens
A polished diagram has limited value if it is not used. The real benefit comes when the landscape is used actively in workshops, investment reviews, dependency analysis, and roadmap discussions.
Best practice: Measure success by decision impact, not visual polish.
Conclusion
An ArchiMate Enterprise Architecture Landscape Diagram is most valuable when it helps an organization move from fragmented understanding to deliberate architectural control. Its role is not simply to visualize the enterprise, but to provide a stable frame for interpreting change across business, application, information, and technology domains.
Its strength lies in selective abstraction, disciplined relationships, and cross-layer traceability. It works best when built for a clear purpose, anchored in stable enterprise concepts such as capabilities, and maintained as part of a governed architecture practice. The diagram should simplify without distorting, reveal dependencies without overwhelming the reader, and support decisions rather than merely document structure.
Used well, it becomes a boundary object between strategy, architecture, and delivery. Executives can use it to test whether investments reinforce enterprise direction. Architects can use it to assess coherence, dependency, and target-state implications. Delivery and transformation leaders can use it to understand sequencing, shared constraints, and cross-domain impact.
The landscape can also be read as an indicator of architecture maturity. If an enterprise cannot produce a clear and trusted landscape, that often points to deeper issues in taxonomy, ownership, or governance. When the landscape is accurate, understandable, and regularly used, it usually reflects a stronger connection between planning and execution.
Ultimately, the diagram should be treated as part of the enterprise management system, not as a one-time modeling exercise. When it is referenced in governance, risk review, portfolio planning, technology lifecycle decisions, and transformation design, it helps the enterprise govern complexity with greater clarity, consistency, and intent.
Frequently Asked Questions
What is enterprise architecture?
Enterprise architecture is a discipline that aligns an organisation's strategy, business operations, information systems, and technology infrastructure. It provides a structured framework for understanding how an enterprise works today, where it needs to go, and how to manage the transition.
How is ArchiMate used in enterprise architecture practice?
ArchiMate is used as the standard modeling language in enterprise architecture practice. It enables architects to create consistent, layered models covering business capabilities, application services, data flows, and technology infrastructure — all traceable from strategic goals to implementation.
What tools are used for enterprise architecture modeling?
Common enterprise architecture modeling tools include Sparx Enterprise Architect (Sparx EA), Archi, BiZZdesign Enterprise Studio, LeanIX, and Orbus iServer. Sparx EA is widely used for its ArchiMate, UML, BPMN and SysML support combined with powerful automation and scripting capabilities.