⏱ 25 min read
Title
ArchiMate Integration Architecture Diagram: Components, Patterns, and Best Practices ArchiMate training
Meta description
Learn how to create an ArchiMate integration architecture diagram to visualize applications, interfaces, data flows, and integration patterns for clearer enterprise architecture design. ArchiMate tutorial for enterprise architects
Keywords
ArchiMate integration architecture diagram, ArchiMate integration view, integration architecture, enterprise architecture diagram, ArchiMate applications, application interfaces, data flow modeling, integration patterns, system integration design, ArchiMate modeling, enterprise integration, architecture visualization ArchiMate layers explained
Introduction
An ArchiMate Integration Architecture Diagram shows how applications, services, data, and enabling technology work together across the enterprise. Where a standard application landscape view tells you what exists, an integration view explains how those parts interact. It shows how information moves, where services are exposed, which platforms mediate communication, and where dependencies create either resilience or fragility. ArchiMate relationship types
That perspective matters because integration is rarely just an interface problem. It is an architectural problem of coordination across systems that evolve at different speeds. Core platforms may remain stable for years, while digital channels, partner APIs, analytics services, and workflow tools change far more often. Without a clear integration view, critical dependencies tend to disappear into middleware configurations, interface spreadsheets, or the memory of a few experienced engineers. ArchiMate gives architects and platform teams a common language for making those structures visible. ArchiMate modeling best practices
A useful integration diagram does more than confirm that systems are connected. It clarifies the nature of those connections. It distinguishes direct service consumption from mediated access, synchronous requests from asynchronous events, and authoritative data from replicated data. It can also show the role of gateways, brokers, integration runtimes, orchestration services, and file-transfer mechanisms. That is important because many enterprise risks are integration risks: hidden single points of failure, duplicated transformation logic, unclear ownership, brittle dependencies, and inconsistent security or monitoring.
The diagram also serves as a practical communication tool. Integration concerns cut across domains and therefore across teams. Business stakeholders may be thinking in terms of onboarding, fulfillment, claims handling, or reporting. Technical teams are usually focused on APIs, topics, queues, schemas, and orchestration logic. An ArchiMate integration view gives both groups a shared level of abstraction. It supports impact analysis, target-state design, roadmap planning, and architecture governance by showing how integration capabilities enable end-to-end value delivery.
For that reason, an ArchiMate Integration Architecture Diagram should not be treated as a technical sketch produced once and filed away. It is a planning and governance instrument. Used well, it helps organizations visualize interaction patterns, manage complexity, and guide change with far greater control.
1. What the Diagram Is and Why It Matters
An ArchiMate Integration Architecture Diagram is a viewpoint that makes enterprise interaction structures explicit. Rather than centering on a single application or infrastructure platform, it focuses on the mechanisms through which systems collaborate. In practice, that usually means combining application components, application services, application interfaces, data objects, and selected technology elements in one coherent model.
What distinguishes this diagram from a general application landscape view is its treatment of integration as an architectural capability in its own right. It does not simply show that two systems exchange data. It shows how they do so, what mediates the interaction, and where responsibilities sit. Those responsibilities may include service exposure, routing, transformation, protocol conversion, buffering, policy enforcement, and orchestration.
This matters because enterprise failure points often sit between systems rather than inside them. A business capability may appear fully supported when viewed application by application, yet still fail operationally because data arrives too late, interfaces are tightly coupled, ownership is unclear, or changes are introduced without coordination. An integration architecture diagram helps expose those weaknesses early. It allows architects to see where synchronous dependencies create fragility, where batch exchanges are too slow for the business need, where a shared platform has become overloaded, or where one domain depends too heavily on another domain’s internal design.
The value of the diagram is therefore both descriptive and prescriptive. It documents how interaction works today, but it also helps define how integration should evolve. That makes it particularly useful in modernization programs, cloud adoption, platform rationalization, and cross-domain governance. A review board, for example, may approve a target pattern in which customer-facing applications consume services through a shared API layer rather than calling the ERP directly, while granting a temporary exception for a legacy warehouse interface that is due for retirement.
A good diagram also sharpens accountability. It can show which application provides a service, which platform exposes it, which component performs transformation, which data object is authoritative, and which technology service supports transport or messaging. That separation of concerns is as useful for operating model design as it is for system design. Support boundaries, stewardship, and change control become easier to assign and govern.
At the same time, the diagram supports standardization without forcing every situation into the same pattern. Enterprises may promote API-led integration, event-driven communication, or reusable shared services as preferred approaches. Those standards only work if exceptions are visible and justified. An integration architecture view can show where legacy file transfer is still required, where partner connectivity imposes constraints, or where a transitional pattern must coexist with the target state for a defined period.
2. Core ArchiMate Concepts for Integration Architecture
To model integration clearly, ArchiMate concepts need to be used with discipline. Precision matters. If every system is represented as a generic box and every connection as a generic line, the model quickly loses explanatory value.
At the application layer, the most important elements are usually the following:
- Application Component: a system or modular part of a system that participates in integration, such as CRM, ERP, identity management, a pricing engine, or an order service.
- Application Service: behavior exposed for use by other components, such as customer profile retrieval, payment authorization, shipment status update, or policy validation.
- Application Interface: the access point through which a service is exposed, such as a REST API, event subscription endpoint, or file drop location.
- Data Object: the information exchanged, such as Customer, Order, Invoice, Claim, or Shipment Event.
Together, these elements provide the basic vocabulary for showing who participates in an interaction, what is exposed, and what information is exchanged.
Several ArchiMate relationships are especially important in integration views:
- Serving: shows that one element provides capability to another.
- Access: shows how a component reads, writes, or uses a data object.
- Flow: shows transfer of information or value between elements.
- Triggering: shows that one behavior or event initiates another.
Using these relationships consistently is essential. A flow between systems says something different from a service being served to a consumer. Both mean something different again from a trigger in an event-driven scenario. Readers should be able to infer architectural intent from the notation, not from a paragraph of explanation beside the diagram.
At the technology layer, the most relevant concepts often include:
- Node
- System Software
- Technology Service
- Communication Path
These become important when the integration mechanism itself is architecturally significant. An API gateway cluster, Kafka platform, managed integration runtime, or secure partner network may need to appear because it shapes resilience, security, or operational dependency.
One of the more common modeling choices concerns where to place integration platforms. Depending on the level of abstraction and the ownership context, an API management platform or broker may be represented either at the application layer or at the technology layer. The choice matters less than consistency. If the enterprise treats the platform as a reusable technical capability, a technology-oriented representation may fit best. If it behaves more like a managed application platform exposing explicit services, an application-layer representation may be clearer.
A practical rule is to avoid drawing every technical endpoint unless it is architecturally significant. The objective is not to reproduce an interface inventory. The objective is to make dependency structure and design intent visible. In most enterprise views, one meaningful service and one or two interfaces are more useful than ten endpoint variants.
A simple example illustrates the point. In a retail architecture, the mobile app may call a Product Availability API exposed through the gateway, while the gateway routes the request to an inventory service. The enterprise diagram does not need to show every URI, token scope, and timeout setting. It does need to show that the channel depends on a mediated service rather than on direct access to the inventory platform.
3. Key Structural Building Blocks of an Integration Diagram
Integration diagrams become easier to design and easier to read when they are organized around three categories:
- Integration participants
- Integration mechanisms
- Integration payloads
This simple structure helps prevent diagrams from becoming overloaded and gives readers a clear way to interpret what they are seeing.
3.1 Integration participants
Integration participants are the producer and consumer applications, domains, or services involved in an exchange. These are usually modeled as application components and application services.
What matters is not just that a system exists, but the role it plays in the interaction. A participant may act as:
- a system of record
- a service consumer
- an event publisher
- an event subscriber
- an orchestration point
- a channel application
- a partner-facing interface provider
Making those roles explicit helps reveal coupling patterns and ownership boundaries. A customer portal that directly invokes five back-end systems plays a very different architectural role from a portal that consumes a single domain API. The first pattern often signals channel-level coupling to internal complexity. The second usually indicates better encapsulation.
Consider a banking example. If the online banking portal calls customer, account, payment, and fraud systems separately, the channel becomes tightly bound to internal service composition. If instead it uses a single Banking Experience API, the integration responsibility is shifted to a managed layer where security, orchestration, and change control can be handled more consistently.
3.2 Integration mechanisms
Integration mechanisms are the mediating elements that shape how interactions occur. Typical examples include:
- API gateways
- integration platforms
- message brokers
- event streaming services
- workflow or orchestration engines
- managed file transfer capabilities
- transformation services
These should be modeled according to architectural responsibility rather than product name alone. A broker is not merely a box in the middle; it decouples producers from consumers and changes failure behavior. A transformation service protects domain autonomy by mapping structures. An API gateway may enforce security, routing, throttling, and policy control. A workflow engine may centralize process coordination that would otherwise be scattered across applications.
For example, in a healthcare setting, a patient portal might submit appointment requests through an API gateway. The gateway validates identity tokens, applies rate limits, and routes traffic to a scheduling service. Confirmation events are then published to an event platform for downstream notification and reporting. In the diagram, each of those mediation responsibilities is architecturally meaningful.
3.3 Integration payloads
Integration payloads are represented mainly through data objects. They become especially important when multiple systems interact around the same business concept but do not share the same structure or ownership model.
For example:
- CRM may hold Customer
- Billing may hold Customer Account
- MDM may hold Party
These concepts may be related, but they are not identical. Showing that distinction is often more valuable than showing protocol detail, because many integration failures originate in mismatched semantics rather than transport problems.
A practical micro-example comes from insurance. A policy administration system may own Policy, a claims platform may manage Claim, and a customer app may display Coverage Summary. Those are related business concepts, but they are not interchangeable. If the integration layer treats them as if they were the same object, confusion and rework are almost guaranteed.
3.4 Why the relationships matter
Relationships give the diagram its explanatory power.
- Serving clarifies who provides capability.
- Flow shows movement of information.
- Access helps identify data authority and synchronization behavior.
- Triggering is particularly useful in event-driven and process-mediated scenarios.
Together, they allow the diagram to answer practical questions:
- Who owns the service?
- Who depends on whom?
- Which data is authoritative?
- Is the interaction direct or mediated?
- Is the interaction request-driven or event-driven?
That combination forms the structural foundation for the integration patterns discussed next.
4. Modeling Enterprise Integration Patterns with ArchiMate
Once the core concepts and structural building blocks are in place, the next step is to model recognizable integration patterns. Starting with pattern intent rather than tooling usually leads to clearer diagrams and better architectural choices.
A useful set of common patterns includes:
- Request-response
- Publish-subscribe
- Event notification
- Orchestration
- Data replication
- File or batch exchange
Each pattern has a distinct architectural meaning and should be modeled accordingly.
4.1 Request-response
In a request-response pattern, a consumer uses an application service exposed by a provider. This is often shown through:
- a consuming application component
- a provider application service
- an application interface
- optionally an API gateway or mediation layer
The key question is whether the interaction is direct or mediated. Direct integration may be simpler in the short term, but it often increases coupling. A mediated pattern can improve security, observability, and governance, although it may also introduce dependency on a shared platform.
A realistic example is an e-commerce checkout service calling a payment authorization service. If the checkout application calls the payment engine directly, every consuming channel may need to handle authentication, retries, and version changes. If the call is routed through a payment API layer, those concerns can be managed centrally.
4.2 Publish-subscribe and event notification
In publish-subscribe, producers and consumers are decoupled through a broker or event platform. The model should show:
- which component publishes
- what event or data object is involved
- which consumers subscribe
- what platform mediates distribution
It is also useful to distinguish between:
- an event that signals state change
- an event that carries business payload
That distinction affects coupling, downstream processing, and data ownership. Many organizations describe themselves as event-driven while still relying on tightly coupled downstream assumptions. ArchiMate can make that visible.
For instance, an order service may publish an OrderCreated event to Kafka. Billing, fulfillment, and analytics subscribe independently. That is very different from a central integration flow that receives the event, enriches it, and pushes it to each consumer in sequence. Both approaches may use the same platform, but they represent different architectural patterns.
4.3 Orchestration
In orchestration, a coordinating component controls the interaction flow across multiple services. The orchestrator should be made explicit rather than implied.
The diagram should show:
- the orchestrating component or service
- the participating services
- the sequence or triggering logic where architecturally relevant
- the data objects used across the flow
This pattern is particularly useful when evaluating whether coordination belongs in a central workflow engine, an integration platform, or a domain service.
A common example is loan origination. A workflow service may coordinate credit check, document validation, fraud screening, and offer generation. If that coordination is hidden inside middleware, ownership and change impact become difficult to manage. If it is modeled explicitly, the architecture makes clear where process logic resides.
4.4 Data replication and batch exchange
For replication and batch patterns, data objects and flow relationships often matter more than service invocation. These patterns should make visible:
- source and target systems
- authoritative versus replicated data
- timing assumptions
- transformation or staging points
- whether the mechanism is strategic, tolerated, or transitional
Integration risk often comes from stale or misunderstood data rather than broken transport alone. A nightly product file sent from ERP to an e-commerce platform may work adequately for static catalog data but fail badly for same-day price changes. The problem is not the file itself; it is the mismatch between business need and integration pattern.
4.5 Make mediation responsibilities explicit
A common modeling mistake is to hide transformation, enrichment, validation, throttling, or policy enforcement inside a generic “integration platform” box. If those responsibilities are architecturally significant, they should be shown explicitly as distinct services or components.
This matters because middleware often accumulates business logic over time. A diagram that shows only connectivity can miss the fact that the integration layer has become a critical operational dependency and a bottleneck for change.
For example, in a logistics environment, an integration service may convert carrier-specific shipment messages into a canonical shipment event before publishing them to downstream consumers. That transformation is not incidental plumbing. It is a design choice with implications for ownership, testing, and lifecycle management.
4.6 Model current and target patterns together when needed
One of the most practical uses of ArchiMate is to model the same business interaction in both current-state and target-state form. For example:
- current state: nightly file transfer between CRM, risk, and billing
- target state: API-based validation plus event-based status propagation
Showing both patterns makes transition complexity visible. It reveals where coexistence is required, where adapters are needed, and where monitoring must cover multiple styles during migration.
This is especially useful in large transformation programs. A manufacturer moving from an on-premise ESB to managed APIs and event streaming may need to support both patterns for several release cycles. Without a diagram that makes the transition explicit, stakeholders often assume the target state arrives all at once.
5. Creating Clear and Actionable Integration Architecture Diagrams
Knowing what to model is only part of the job. The diagram also has to support decisions. Clarity, scope, and consistency matter as much as notation.
5.1 Start with the decision purpose
Before drawing anything, define the decision the diagram is meant to support. Typical purposes include:
- platform rationalization
- dependency analysis
- target-state design
- modernization planning
- security review
- integration governance
If the purpose is unclear, the result is usually a generic landscape picture with little analytical value. Scope and abstraction should follow the question being asked.
A board reviewing whether to retire a legacy ESB needs a different view from a delivery team designing one API. The first needs concentration risk, migration dependencies, and lifecycle status. The second needs more detailed service interaction and ownership information.
5.2 Model roles, not product names
Diagrams are more durable when they show functional roles such as API management, event distribution, transformation, orchestration, or file exchange rather than vendor branding. Product names may still appear in supporting documentation, but the architecture view should remain useful even when tooling changes.
This does not mean products are irrelevant. It means the enterprise view should express design intent first. “Event streaming platform” is usually more useful in an architecture review than a branded product label unless the product itself is central to the decision.
5.3 Use visual hierarchy
Core domain or business applications should usually remain visually dominant. Shared mediation services and infrastructure support should be explicit, but secondary. Data objects should be shown selectively, with emphasis on information that is architecturally important.
Useful grouping approaches include:
- by business domain
- by platform responsibility
- by internal versus external boundary
- by lifecycle state
- by current versus target architecture
In most cases, a smaller diagram with strong grouping is more effective than an exhaustive one. Readers should be able to understand the main interaction structure within a few moments.
5.4 Make risk visible
A decision-useful diagram should show more than the intended interaction path. It should also surface fragility, such as:
- single gateways supporting many critical services
- overloaded broker clusters
- hidden dependencies on legacy systems
- duplicated transformation logic
- manual handoffs
- nonstandard protocols
- temporary interfaces becoming permanent
These are often the issues that matter most in governance reviews because they affect resilience, supportability, and the cost of change.
A simple annotation can make a large difference. Marking a legacy FTP exchange as “temporary” with a retirement date, or identifying a broker cluster as shared by all customer-facing channels, immediately changes the quality of the discussion.
5.5 Distinguish steady state from transition state
Old and new integration mechanisms often coexist during modernization. A clear diagram should indicate whether an interface or platform is:
- strategic
- tolerated
- temporary
- scheduled for retirement
This can be shown through plateaus, color conventions, or annotations. Without that distinction, stakeholders may mistake transition architecture for target architecture.
The same approach works well for lifecycle governance. A review board may mark an ESB as tolerated until 2027 while designating managed APIs and event streaming as strategic patterns for new integrations. That simple distinction helps teams avoid investing further in the wrong part of the landscape.
5.6 Give every relationship a clear meaning
If a connection exists, the reader should know whether it represents:
- service consumption
- event propagation
- data synchronization
- orchestration control
- platform dependency
Ambiguous lines weaken trust in the model and make impact analysis less reliable. Consistent relationship usage is therefore more than a notation issue; it directly affects decision quality.
5.7 Treat the diagram as a living governance artifact
An integration architecture diagram is most useful when it is linked to:
- interface inventories
- standards and guardrails
- ownership information
- roadmaps
- lifecycle status
- risk assessments
That is what turns the diagram from a workshop output into an enterprise governance tool. In mature organizations, the model is referenced during architecture review, change planning, and platform investment decisions rather than recreated from scratch each time.
6. Common Challenges, Pitfalls, and Governance Considerations
Even a well-structured diagram can become misleading if it is not governed carefully. Integration landscapes evolve quickly, and the model must evolve with them.
6.1 Outdated models
New APIs appear, event topics multiply, temporary file exchanges become permanent, and cloud services introduce hidden dependencies. If the diagram is not kept current, it may still look authoritative while no longer reflecting reality.
That is dangerous because outdated models distort investment decisions, impact assessments, and resilience planning. A stale integration view can be worse than no view at all because it creates false confidence.
6.2 Abstraction drift
A common problem is that enterprise-level diagrams slowly absorb solution-level detail: endpoint names, protocol variants, queue structures, environment-specific deployment information, and transformation rules. The result is a model too dense to support enterprise decisions.
The opposite problem occurs as well. A model may become so abstract that it hides latency, sequencing dependencies, or middleware bottlenecks.
The answer is to define modeling rules for what belongs in:
- enterprise integration views
- solution architecture views
- platform engineering documentation
Without that discipline, diagrams become inconsistent and difficult to compare.
6.3 Treating all integrations as equal
Not every integration deserves the same architectural attention. Some are mission-critical operational dependencies; others are low-risk informational feeds. If the diagram gives them equal weight, governance effort becomes shallow and unfocused.
Useful classification criteria include:
- criticality
- change frequency
- data sensitivity
- recovery expectations
- regulatory significance
This helps direct review effort where enterprise risk is greatest. A customer identity event stream and a monthly reference-data feed should not be governed in exactly the same way.
6.4 Hidden ownership failure
Integration sits between teams. One team may own the provider, another the consumer, another the gateway, and no one the end-to-end interaction. Many recurring incidents are caused less by flawed technology than by fragmented accountability.
A mature integration architecture therefore needs explicit ownership for:
- interfaces
- schemas
- event contracts
- transformation logic
- operational support
- service-level expectations
Without that, the architecture will degrade no matter how elegant the diagram looks.
6.5 Pattern sprawl without principles
API-led, event-driven, batch, and partner-mediated exchanges may all be valid. But without decision criteria, teams tend to choose patterns based on familiarity, local optimization, or project deadlines rather than enterprise fit.
Over time, that creates:
- duplicated capabilities
- inconsistent security
- uneven monitoring
- support complexity
- avoidable technical debt
A practical response is to define pattern selection guardrails, such as:
- when synchronous APIs are preferred
- when events are appropriate
- when batch remains acceptable
- what requires architecture review
The point is not to eliminate variety. It is to make variety intentional.
6.6 Security and compliance blind spots
Integration diagrams often show connectivity without showing trust boundaries, sensitive data handling, or external exposure. Governance should address where data is transformed, cached, exposed, or transferred across regulated boundaries.
In some environments, architects also need to consider:
- auditability
- data residency
- retention
- non-repudiation
- encryption boundaries
- identity propagation
These concerns should shape both the architecture model and the review process rather than being deferred to implementation. This is especially relevant in identity modernization, where a move to centralized identity, federation, and token-based access changes both integration design and trust boundaries.
6.7 Weak lifecycle management
Interfaces, events, and shared services need:
- versioning policies
- deprecation rules
- testing expectations
- observability standards
- retirement processes
Without these, integration sprawl turns into operational debt. Mature organizations govern integration as a portfolio, tracking strategic and legacy patterns and reviewing whether each new integration strengthens or weakens enterprise coherence.
7. Using Integration Diagrams for Transformation and Decision-Making
The strongest reason to maintain an integration architecture diagram is not documentation for its own sake. It is decision support.
7.1 Transition planning
Transformation often means replacing one interaction model with another:
- batch interfaces become APIs
- direct calls move behind gateways
- point-to-point messaging is consolidated into event platforms
- central orchestration is decomposed into domain services
An integration diagram makes these shifts visible across plateaus and migration steps. It shows where coexistence is unavoidable, where temporary adapters are needed, and where sequencing risks may delay the target state.
Many transformation failures occur not in the target design itself, but in the unmanaged complexity of the transition period. The diagram helps expose that complexity before implementation begins.
7.2 Option comparison
Architects are often asked to compare multiple solution paths under time, budget, and platform constraints. A new digital capability, for example, might be supported through:
- direct integration with a core system
- an existing shared integration platform
- a newly exposed domain API
- an event-driven pattern via a broker
Each option creates a different dependency structure and future operating model. By modeling those alternatives in ArchiMate, architects can compare them against criteria such as:
- coupling
- reuse potential
- resilience
- observability
- platform alignment
- legacy containment
That produces a stronger basis for decision-making than project preference alone.
7.3 Impact and dependency analysis
During modernization, organizations often underestimate how many services, processes, or channels depend on a particular application or middleware component. An integration architecture diagram makes those relationships visible.
If a broker is retired, an ERP is moved to SaaS, or a master data service is redesigned, the model can reveal:
- which consumers are affected
- which transformations must change
- which processes depend on the interaction
- which operational flows need retesting
That helps avoid local changes that trigger enterprise-wide disruption.
7.4 Investment prioritization
Not every integration issue deserves the same level of funding. Some interfaces are inconvenient but low-risk. Others create strategic fragility because they sit on critical customer journeys, regulatory processes, or shared operational platforms.
By linking integration structures to business importance and concentration risk, architects can identify where modernization will produce the greatest value. This is especially useful in large portfolios where technical debt is widespread and resources are limited.
7.5 Decision traceability
Architecture boards often approve standards, exceptions, and transition states, but those decisions are easily lost if they are not anchored in a model. An integration view can capture:
- why a pattern was selected
- where a deviation is tolerated
- which dependencies are temporary
- what conditions must be met before retirement of a transition state
That turns the model into a living record of architectural intent. For example, a board may record that a direct SAP integration is approved only for a 12-month transition, after which the consuming application must move to the domain API and shared event model.
7.6 Reuse the diagram at key decision points
The diagram is most valuable when it is used repeatedly:
- before funding approval
- during solution shaping
- at migration planning checkpoints
- in architecture review boards
- during post-implementation review
Used this way, it becomes a mechanism for steering transformation and maintaining long-term coherence rather than a one-time deliverable.
Conclusion
An ArchiMate Integration Architecture Diagram is most valuable when integration is treated as a strategic design domain rather than background plumbing. Its strength lies in making interaction structure visible: who depends on whom, how services are exposed, where data moves, what mediates communication, and where risk or control is concentrated.
The strongest diagrams are built from a small set of clear concepts: participants, mechanisms, payloads, and patterns. They use ArchiMate elements and relationships consistently, make mediation responsibilities explicit, and distinguish current-state from target-state design. Just as important, they are governed as living artifacts linked to ownership, standards, lifecycle policies, and transformation roadmaps.
In practice, that is what turns the diagram into more than documentation. It becomes a tool for impact analysis, option comparison, investment prioritization, and transition planning. It helps architects surface hidden dependencies, challenge weak pattern choices, and guide modernization without losing enterprise coherence.
The goal is not to diagram everything. It is to make enterprise interaction design understandable, governable, and actionable. Used well, an ArchiMate Integration Architecture Diagram helps organizations reduce accidental complexity, improve resilience, and evolve their integration landscape with greater control.
Frequently Asked Questions
How is integration architecture modeled in ArchiMate?
Integration architecture in ArchiMate is modeled using Application Components (the systems being integrated), Application Services (the capabilities exposed), Application Interfaces (the integration endpoints), and Serving relationships showing data flows. Technology interfaces model the underlying protocols and middleware.
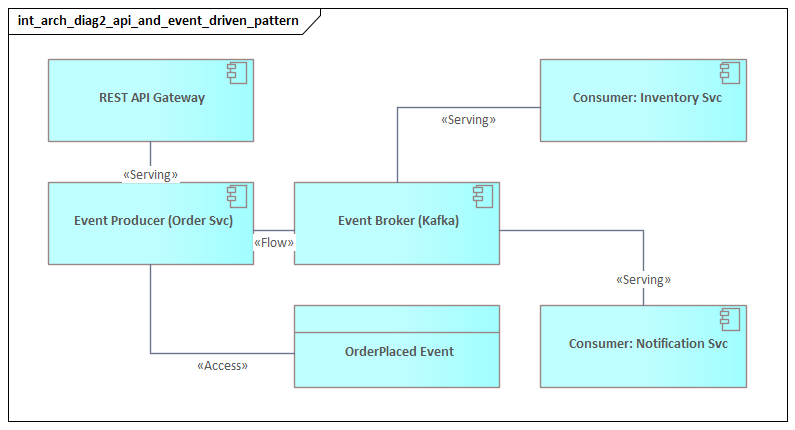
What is the difference between API integration and event-driven integration?
API integration uses synchronous request-response patterns where a consumer calls a provider and waits for a response. Event-driven integration uses asynchronous message publishing where producers emit events that consumers subscribe to — decoupling systems and improving resilience.
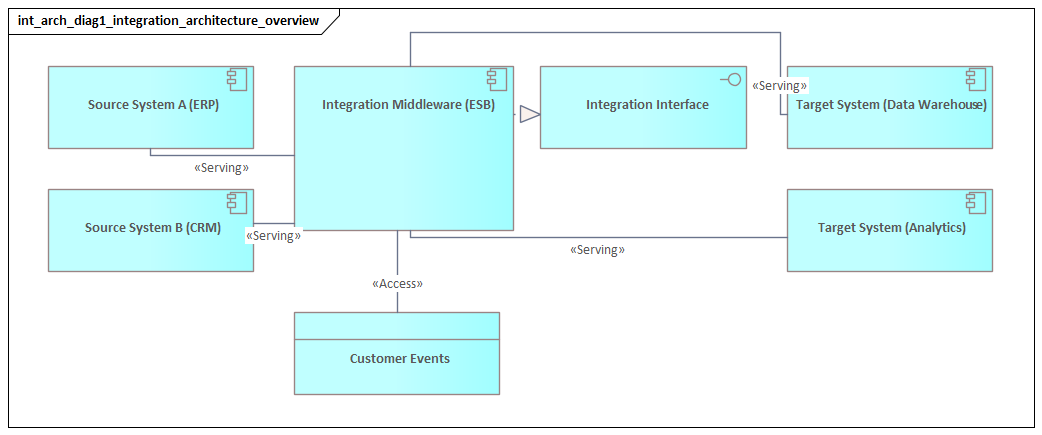
How does ArchiMate model middleware and ESB?
Middleware and ESB platforms appear in ArchiMate as Application Components in the Application layer that expose Integration Services. They aggregate connections from multiple source and target systems, shown through Serving and Association relationships to all connected applications.