⏱ 20 min read
ArchiMate Application Cooperation Diagram Explained | Components, Interfaces & Collaboration ArchiMate training
Learn what an ArchiMate Application Cooperation Diagram is, how it models application components, interfaces, and interactions, and when to use it in enterprise architecture. ArchiMate tutorial for enterprise architects
ArchiMate Application Cooperation Diagram, Application Cooperation Diagram explained, ArchiMate application diagram, ArchiMate application collaboration, application component diagram, ArchiMate interfaces, enterprise architecture modeling, ArchiMate application layer, ArchiMate relationships, application interaction diagram ArchiMate layers explained
Introduction
An ArchiMate Application Cooperation Diagram shows how applications work together to deliver a business outcome. Instead of describing one system in isolation, it focuses on collaboration across the application layer: which applications provide services, which consume them, how responsibilities are split, and where requests or information move between systems. ArchiMate relationship types
That perspective matters because very few enterprise capabilities depend on a single application. Order fulfillment may involve a customer portal, CRM, pricing engine, order management platform, warehouse system, and payment service. Employee onboarding may span HR, identity management, workflow, and directory services. The business sees one outcome; the architecture depends on coordinated behavior across several systems.
This viewpoint is useful in landscapes shaped by ERP platforms, CRM suites, workflow tools, analytics services, portals, and external SaaS products. Architects need a way to make those relationships understandable without dropping immediately into implementation detail. The Application Cooperation Diagram fills that gap. It is detailed enough to support planning, governance, and design conversations, but abstract enough to remain readable for mixed audiences.
Its value becomes clear in the questions it helps answer. Which application is the system of record for customer data? Which one provides pricing or inventory information to others? Where does an order begin, and which systems validate, enrich, and fulfill it? Which integrations are central to a capability, and which create unnecessary fragility? By making cooperation visible, the diagram exposes dependencies that are often hidden in process models, application inventories, or infrastructure views.
That is why the viewpoint is so useful during transformation. Replacing a legacy platform, introducing a new SaaS product, modernizing IAM, or moving services to the cloud rarely affects only the target system. Downstream consumers, service contracts, interfaces, and shared data flows are usually involved as well. A cooperation view helps teams understand those consequences before migration or design decisions are locked in.
It also works across stakeholder groups. Enterprise architects use it to assess strategic dependencies and rationalization opportunities. Solution architects use it to define service boundaries and integration patterns. Delivery teams use it to understand touchpoints before implementation begins. Business stakeholders benefit too, because the diagram explains—at a manageable level—why a capability depends on several applications working together behind the scenes.
In practice, this viewpoint helps architects treat the application estate as a designed whole rather than a collection of systems. It connects concerns such as modularity, interoperability, ownership, and change impact to concrete relationships between applications. For organizations managing a complex application landscape, it is one of the most practical ArchiMate viewpoints available. ArchiMate modeling best practices
What an ArchiMate Application Cooperation Diagram Is
An ArchiMate Application Cooperation Diagram is a viewpoint used to model how application-layer elements collaborate to deliver behavior and expose services. It is not just a picture of applications linked by lines. Its purpose is to show meaningful cooperation between application components, the services they provide, the interfaces through which those services are exposed, and, where useful, the information exchanged between them.
The emphasis is on interaction rather than internal construction. The diagram is less concerned with how an application is built than with what it provides to other applications and what it depends on in return. That makes it particularly effective when the architectural question is about dependency, service provision, integration style, or ownership across systems.
One of the defining features of this viewpoint is its focus on services and interfaces rather than implementation detail. A customer portal may consume a customer profile service from a CRM platform. An order management application may rely on pricing and inventory services from separate systems. In an IAM modernization, a portal might consume authentication and token services from a new identity platform while several legacy applications still depend on an older directory service. The diagram earns its keep by making those relationships explicit.
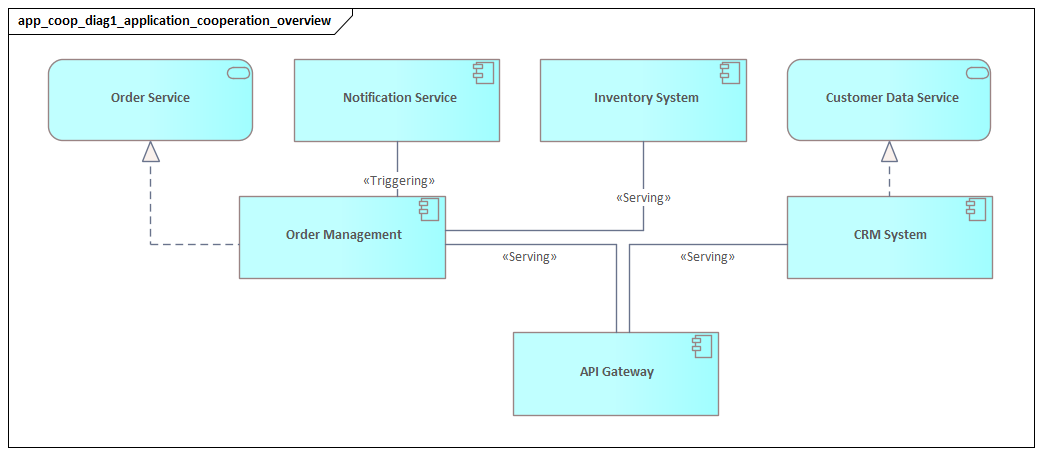
A retail example makes this concrete. An e-commerce storefront may call a pricing service from a pricing engine, submit orders to an order management platform, and retrieve stock availability from a warehouse service. Those three integrations are not just technical connections; they define how the sales channel depends on the rest of the application estate. A cooperation diagram captures that structure cleanly.
The viewpoint can be modeled at different levels of abstraction. A high-level version may show only the main application components and the services between them. A more detailed version may add interfaces, key data objects, or event flows where those details materially affect understanding. The right level depends on the question being asked.
It also captures architectural intent. Most enterprises have many interfaces between systems, but not all of them reflect good architecture. By modeling cooperation explicitly, architects can assess whether application relationships align with principles such as loose coupling, clear service boundaries, reuse, and separation of concerns. In that sense, the viewpoint supports evaluation as much as description.
Put simply, the Application Cooperation Diagram shows the collaborative structure of the application layer. It explains how applications participate in a network of provided and consumed services, how responsibilities are distributed, and how those interactions support broader enterprise capabilities.
Core Elements and Relationships
To use this viewpoint well, it helps to understand the core concepts that appear in it. The diagram is valuable because it makes responsibility and dependency visible, but that only works when the right elements and relationships are modeled clearly.
Application Component
The most common structural element is the application component. This represents an identifiable application unit such as a billing platform, CRM system, workflow engine, customer portal, or product information system. In enterprise architecture, components are usually modeled at the level that matters for planning and governance, not at the level of every internal module.
For example, a CRM suite may appear as a single application component in a cooperation view if the goal is to understand how other systems depend on it. If the CRM exposes architecturally distinct services through separate ownership or lifecycle arrangements, it may be worth decomposing further. Otherwise, keeping it whole usually makes the model clearer.
Application Service
The application service represents the behavior an application makes available to others. If the application component answers the question “who provides it,” the application service answers “what is provided.” Typical examples include customer lookup, order validation, payment authorization, pricing, inventory availability, or identity verification.
This is one of the most important concepts in the diagram because it separates the provider application from the capability consumers actually depend on. That distinction leads to better architecture. Consumers should depend on stable services, not on the provider’s internal design or technology choices.
A simple banking example illustrates the point. A mobile app may depend on an “Account Balance Service” provided by core banking. It should not need to know whether the provider uses a monolith, packaged software, or a modern service layer internally. The service is the architectural contract that matters.
Application Interface
The application interface represents the access point through which a service is exposed. In practice, this may correspond to an API, message endpoint, web interface, integration gateway, or similar mechanism.
Interfaces matter when the discussion involves standardization, security boundaries, channel separation, or integration discipline. Two services may be provided by the same application component but exposed through different interfaces for different consumers. When that distinction affects architecture decisions, it is worth modeling.
For instance, an identity platform may expose one interface for browser-based authentication and another for machine-to-machine token issuance. Both relate to identity services, but they carry different security controls, consumers, and governance implications.
Data Object
A data object is often included when information ownership or exchange is central to the story the diagram needs to tell. Examples include customer record, invoice, shipment update, product catalog entry, or access token.
The diagram is not intended to become a full data model. Even so, selected data objects can clarify which application owns important information, which applications consume it, and where synchronization or duplication risks may exist.
A logistics example is common here. If a transport management system publishes a shipment update consumed by a customer portal and analytics platform, showing the shipment update as a data object can make ownership and downstream dependency much easier to understand.
Key Relationships
The relationships between these elements are what make the diagram analytically useful.
- A serving or used-by relationship shows that one application service supports another application component or behavior.
- A realization relationship shows that an application component realizes an application service.
- An assignment relationship can connect interfaces or behavior to the responsible structural element.
- A flow relationship can show the movement of information, requests, or events between applications.
These distinctions matter. If every connection is drawn as a generic line, the model quickly loses precision. When service provision, information flow, and responsibility are shown clearly, the diagram becomes far more useful for impact analysis, integration review, and governance.
How to Read and Interpret the Diagram
Once the core elements are clear, the next step is interpretation. The meaning of the diagram comes less from the symbols themselves and more from the dependency structure they reveal.
A good place to start is with the main application components. Which ones are primarily providers? Which are mainly consumers? Which do both? Even that first pass gives a useful sense of how responsibility is distributed across the landscape.
Then look at service direction. Understanding who depends on whom is often the most important insight in the model. An application that provides a service used by many others may be much more critical than it first appears. By contrast, an application that consumes many services may represent a concentration of dependency even if its own functional scope is relatively small.
Next, consider the shape of cooperation. Two applications connected through one clear service may indicate healthy modularity. The same two applications connected through many services, interfaces, or flows may point to tight coupling or poorly defined boundaries. The issue is not simply whether systems interact, but whether they do so in a clean and intentional way.
Interfaces deserve close attention. If many consumers use one standardized interface, that often suggests architectural discipline. If each consumer uses a different interface for similar purposes, the model may be signaling inconsistency, duplication, or unmanaged evolution. In an HR and IAM landscape, for example, an architecture board may reject a direct HR-to-directory integration and require all identity updates to pass through the IAM platform’s provisioning interface instead.
Where data objects or flows are shown, read them as indicators of information dependency, not just message exchange. If multiple applications repeatedly exchange the same core data, that may suggest replication risk or weak ownership boundaries. If one application mediates all access to a key data object, that may indicate strong control—or over-centralization. In event-driven designs, a flow may represent a Kafka topic carrying order-created or shipment-updated events rather than a synchronous request.
It is also worth looking for asymmetry. A portal that consumes ten services from across the estate may be operationally fragile even if it appears simple to business users. A master data platform that provides services to half the landscape may deserve stronger resilience controls than its budget history would suggest. The diagram often reveals these realities faster than a spreadsheet ever will.
Finally, read the diagram in the context of change. If one application is replaced, upgraded, or unavailable, what else is affected? Which consumers depend on its services? Which interfaces would need redesign? Which information exchanges would require migration planning? This is where the diagram becomes a working architecture tool rather than static documentation.
Common Use Cases in Enterprise Architecture
With the core concepts and interpretation approach in place, the next question is where this viewpoint proves most useful in practice. The Application Cooperation Diagram is especially valuable when architects need to move from a general application inventory to a more actionable understanding of dependency and change.
Capability-Based Architecture
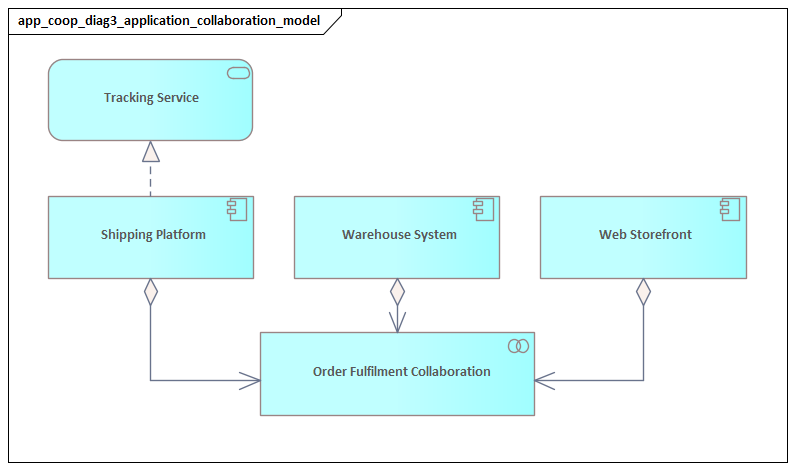
Many business capabilities depend on several applications working together. Customer onboarding, claims handling, procurement, and order fulfillment are familiar examples. A cooperation diagram helps show which applications contribute to the capability and how they interact through services.
That matters because organizations often speak as if one system “owns” a capability when the outcome actually depends on coordination across several platforms. The diagram makes that shared delivery model visible and supports better ownership and governance discussions.
Application Rationalization
The viewpoint is also useful in rationalization and simplification work. By showing which services applications provide and consume, the model can reveal overlap, duplication, and unnecessary intermediaries.
For example, several applications may expose similar customer notification services, or a legacy application may sit between systems without adding meaningful architectural value. A cooperation diagram helps distinguish between an application that can be retired cleanly and one whose removal would trigger broader redesign.
Transformation and Migration Planning
This is one of the most practical uses of the diagram. When a new platform is introduced or a legacy application is replaced, architects need to understand how change will propagate through the application landscape.
A cooperation view can show temporary coexistence, staged migration, dual service provision, or interface adaptation. In an IAM modernization, the model may show both the legacy access management tool and the new cloud identity provider during transition, with different applications moving in waves. That makes it easier to decide what must be stabilized first and which consumers can move later.
A realistic example is ERP replacement. During a phased migration, the legacy ERP may continue to provide invoicing while the new platform takes over procurement and supplier master data. The cooperation diagram can show which downstream systems still depend on the old invoicing service and which have already shifted to the new platform. Without that view, migration plans tend to be optimistic and incomplete.
Integration Governance
In many enterprises, integration grows organically over time. APIs, file exchanges, middleware routes, event streams, and direct connections accumulate in ways that do not always align with target architecture principles. The cooperation diagram provides a structured basis for reviewing those patterns.
It can support design authority discussions by showing whether a proposed solution consumes an existing service appropriately, introduces unnecessary coupling, or bypasses approved interfaces. A team may propose publishing customer events directly from a CRM database extract, while the architecture board requires publication through a governed event service instead.
Risk and Resilience Analysis
The diagram is also useful for identifying concentration risk and fragile dependencies. An application may seem minor until the model shows that many others rely on one of its services. In that case, the cooperation view reveals hidden criticality.
That insight can support resilience measures such as decoupling, interface standardization, clearer ownership, or service replication. This is especially important in environments where outages or failed releases have broad business impact.
Consider a payment gateway used by web sales, call center ordering, subscription billing, and refunds processing. If the cooperation diagram shows all four depending on the same authorization service through a single interface, the organization has a clear case for resilience testing, failover design, and change control around that service.
Cross-Team Communication
Finally, the viewpoint helps different stakeholder groups discuss the same landscape using a shared model. Enterprise architects, solution architects, delivery teams, and product owners often describe dependencies in different ways. The cooperation diagram gives them a common structure for discussing responsibility and interaction without moving too quickly into implementation detail.
Step-by-Step Approach to Creating an Effective Diagram
The earlier sections explained what the diagram is, the concepts it uses, and how to interpret it. The following approach helps create a diagram that supports real architectural decisions.
1. Start with the Architectural Question
Begin by defining what the diagram needs to explain. Are you analyzing a business capability, assessing the impact of replacing an application, reviewing integration discipline, or supporting a migration roadmap?
This matters because the question determines the level of abstraction. A portfolio decision may need only a high-level service view. A design governance discussion may require interfaces and key information flows. Diagrams become weak when they try to answer too many unrelated questions at once.
2. Define the Scope
Decide which applications belong in the view and which do not. Include only the applications materially involved in the cooperation being analyzed. Utilities, generic platforms, or peripheral systems should appear only if they affect the architectural decision.
A tightly scoped diagram is easier to understand and more useful in workshops. In practice, it often helps to center the view on one capability, one transformation initiative, or one stage in a value stream.
3. Identify the Main Application Components
List the primary applications involved and validate their role with stakeholders. At this stage, avoid unnecessary decomposition. Application components should be modeled at the level where ownership and interaction are meaningful.
If one platform exposes several architecturally distinct responsibilities, separate them. Otherwise, keep the component whole. This step often surfaces disagreement about what counts as one application versus a platform or module, which is itself useful architectural clarification.
4. Model the Relevant Services
Once the components are clear, identify the services that explain why cooperation exists. This is the point where the diagram moves beyond a simple application map.
Service naming matters. Name services from the consumer’s perspective and in terms of business value rather than technical mechanics. “Customer Profile Access” is more useful than “CRM API.” “Policy Quote Service” is better than “Underwriting Endpoint.” Well-named services make the model easier to understand for both technical and non-technical stakeholders.
5. Add Interfaces and Information Exchanges Selectively
Only add interfaces, flows, or data objects where they materially change the meaning of the model. If the architecture discussion involves security boundaries, standardization, middleware dependency, system-of-record questions, or event architecture, these details are worth showing.
If they do not influence the decision, leave them out. A common mistake is to include every endpoint and exchange, turning the diagram into an integration schematic rather than an architecture view.
6. Validate Dependency Direction and Ownership
Review every relationship and confirm that provider, consumer, and responsibility are clear. Ambiguous ownership, circular dependencies, duplicated service provision, or consumers bypassing intended interfaces are often exposed at this stage.
If the diagram reveals unclear ownership, that is not a modeling failure. More often, it is an architectural issue the model has surfaced successfully.
7. Refine for Readability
Finally, simplify the presentation so the main message is visible quickly. Group related applications, align provider-consumer direction consistently, and remove anything that does not support the purpose of the view.
The best diagrams are not the most detailed. They are the ones that help stakeholders understand the cooperation model quickly enough to make better decisions.
Best Practices, Pitfalls, and Governance Considerations
Because the Application Cooperation Diagram is often used for planning and governance, its quality depends not only on notation but also on modeling discipline.
Best Practices
Model at a consistent level.
Do not mix enterprise applications, microservices, middleware products, and technical endpoints in the same view unless that is explicitly the purpose.
Make service boundaries explicit.
The diagram is most useful when it shows intentional interaction contracts rather than accidental technical connectivity.
Link cooperation to ownership.
A dependency matters more when it is tied to accountable ownership. In mature practices, the services and interfaces shown in the model are connected to owners, standards, and lifecycle states such as strategic, transitional, tolerated, or sunset.
Keep the model decision-focused.
Every element in the diagram should help answer the architectural question defined at the start.
Use examples sparingly but concretely.
A small number of realistic labels—such as pricing service, identity token service, or shipment update event—makes a model easier to understand than a page of generic names like Service A and Service B.
Common Pitfalls
Over-modeling.
Trying to capture every integration path in one diagram usually produces a dense picture that supports neither analysis nor communication.
Under-modeling.
Showing applications as connected without clarifying the nature of the dependency may produce a neat-looking diagram that offers little practical value.
Treating the current state as the whole story.
In transformation work, temporary coexistence and migration relationships may matter more than the baseline architecture.
Using the diagram as passive documentation.
The viewpoint is most valuable when used actively in design review, roadmap planning, and impact assessment.
Confusing interfaces with services.
An API gateway endpoint is not the same thing as the business-relevant service it exposes. Mixing the two weakens the model and often leads to poor governance discussions.
Governance Considerations
The diagram becomes most powerful when treated as a living architecture asset. Changes to major application interactions should be reviewed against principles such as reuse before new build, approved interface consumption, avoidance of unnecessary point-to-point integration, event publication through governed channels, and clear system-of-record ownership.
Used this way, the cooperation diagram supports architecture review boards, change control, solution assurance, and risk review. It also supports technology lifecycle governance. For example, showing which applications still depend on a sunset integration broker or a tolerated identity platform helps boards prioritize remediation decisions and sequence investment more realistically.
Conclusion
An ArchiMate Application Cooperation Diagram helps architects understand the application estate as a network of responsibilities, services, and dependencies rather than as a collection of isolated systems. That is its central value.
The viewpoint works because it combines a clear conceptual structure—application components, services, interfaces, and key information relationships—with practical value in planning, interpretation, and governance. It helps architects identify who provides what, who depends on whom, where important information moves, and how change in one application may affect many others.
That matters even more in modern enterprises, where business capabilities are usually delivered through coordinated behavior across multiple platforms. Cloud adoption, SaaS integration, API-led design, IAM modernization, and event-driven architecture all increase the need to understand cooperation explicitly. Without that visibility, complexity tends to grow faster than the organization’s ability to govern it.
Used well, the Application Cooperation Diagram supports capability mapping, rationalization, migration planning, resilience analysis, integration governance, and lifecycle management. More importantly, it improves decision quality. It helps teams judge where to decouple, where to standardize, where to clarify ownership, and where hidden dependencies create risk.
In that sense, the diagram is more than a modeling artifact. It is a practical architecture tool for designing application landscapes that are understandable, governable, and easier to change.
Frequently Asked Questions
What is enterprise architecture?
Enterprise architecture is a discipline that aligns an organisation's strategy, business operations, information systems, and technology infrastructure. It provides a structured framework for understanding how an enterprise works today, where it needs to go, and how to manage the transition.
How is ArchiMate used in enterprise architecture practice?
ArchiMate is used as the standard modeling language in enterprise architecture practice. It enables architects to create consistent, layered models covering business capabilities, application services, data flows, and technology infrastructure — all traceable from strategic goals to implementation.
What tools are used for enterprise architecture modeling?
Common enterprise architecture modeling tools include Sparx Enterprise Architect (Sparx EA), Archi, BiZZdesign Enterprise Studio, LeanIX, and Orbus iServer. Sparx EA is widely used for its ArchiMate, UML, BPMN and SysML support combined with powerful automation and scripting capabilities.