The export looks fine until it doesn't
Rendering an architecture diagram outside its modelling tool is one of those tasks that appears finished long before it is correct. The shapes are in the right places, the arrows connect the right things, and a quick look at one diagram suggests the job is done. Then you look at thirty and find three distinct failure modes, each of which makes some diagrams unreadable while leaving others untouched.
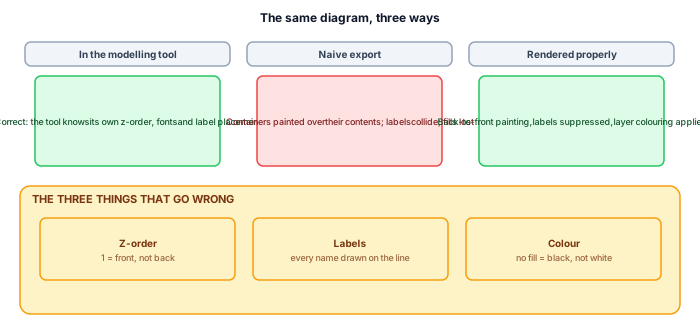
Z-order: 1 means front
Enterprise Architect stores each shape's stacking with a Sequence number where 1 is front-most and larger numbers sit further back. This is the opposite of the intuition most developers bring, which is that a higher number means "on top".
Painting shapes in ascending sequence therefore draws the back-most shape last, on top of everything else. On a diagram with no containers you will never notice. On a diagram with swimlanes or boundary frames — which carry the highest sequence numbers precisely because they belong at the back — every frame is painted over the elements it contains.
The symptom is distinctive and easy to misdiagnose: the diagram renders as a handful of large empty boxes. It looks like the elements failed to export. They did not; they are underneath.
# wrong: back-most shape painted last
for node in sorted(nodes, key=lambda n: n.sequence):
    paint(node)

# right: back to front
for node in sorted(nodes, key=lambda n: n.sequence, reverse=True):
    paint(node)
Connector labels: the wall of text
EA draws each relationship's name on the connector. In a repository where relationships are named descriptively — "cross-project application service supports end-to-end process" — a view with thirty connectors becomes a mat of overlapping text covering the element names underneath.
The fix is not to strip the names from the model; they are useful in relationship tables and search. It is to suppress their rendering. In EA this is per-link geometry, and there is a subtlety: the label has six possible anchor slots (left, middle and right, each top and bottom), and which one is used depends on the connector type and routing. Hiding only the middle-top slot leaves labels on a subset of connectors — which is worse than leaving them all on, because the result looks arbitrary.
Set HDN=1 on all six label slots, not just the one you found by inspecting a single connector. Half-suppressed labels are a recognisable symptom of exactly that shortcut.
Default fill is black
The third failure is pure SVG. An <rect> with no fill is filled black, not white and not transparent. If your stylesheet colours shapes by layer with selectors scoped to a container class, and one rendering context uses a different container class — a thumbnail, say, versus a full diagram — every shape in that context falls through to the default.
At full size a black rectangle is obviously wrong. At thumbnail size, a grid of small black rectangles reads as "the diagrams are still loading" and gets ignored rather than reported. This one can survive a long time in production.
Fonts decide more of the layout than you think
A quieter divergence sits under every label: text metrics. EA measured each label with Windows GDI and the font the architect had installed; the browser measures the same string with its own engine and whatever font your stylesheet resolves to. The differences are small per character and cumulative per label, and the symptom is text that fit comfortably inside its shape in the tool overflowing the shape's boundary in the export — or worse, colliding with the label of the neighbouring element, on precisely the dense diagrams where legibility mattered most.
There are two honest responses. The thorough one is to measure at export time with the same font the portal will serve — render the text with the actual font file, take the real extents, and wrap or shrink accordingly, so the geometry decisions are made against the truth. The pragmatic one is to serve a font metrically close to the tool's default, keep label font-size a point smaller than fidelity purists would like, and adopt a deterministic overflow policy: wrap at word boundaries up to two lines, then ellipsis with the full name in a tooltip and, more importantly, on the element's own page. What does not work is ignoring the question, because the failure is not cosmetic — a label that escapes its shape becomes visually attached to the wrong shape, and a reader who cannot tell which box a name belongs to has been actively misled.
Connectors: waypoints, arrowheads and the notation contract
Element boxes are the easy half of a diagram; the meaning mostly travels in the lines. Two obligations here, one geometric and one semantic.
The geometric one is honouring the architect's routing. EA stores each connector's bend points, and a renderer that ignores them and draws naive straight lines undoes hours of deliberate layout — lines slicing through element boxes, parallel flows collapsing onto each other. Read the waypoints, reproduce the orthogonal routing where it was orthogonal, and only fall back to computed routing for connectors that never had custom geometry. The fallback deserves care too: route around shapes rather than through them, because every line through a box is a small vote against the portal's credibility.
The semantic obligation is the arrowheads. ArchiMate's notation packs real meaning into line endings and styles — the closed triangle of realization, the open half-arrow of assignment versus the plain open head of a flow, serving's solid line against realization's dashes. An architect reads these the way a musician reads clefs, and a renderer that draws every relationship as a generic arrow has not simplified the diagram; it has deleted a layer of information while leaving the impression that nothing is missing. The notation table is finite and documented; implement all of it once, test it against a fixture diagram that contains every relationship type, and never let a new relationship type fall through to a default arrow silently.
Nesting, clipping and the parent chain
Container shapes introduce the same coordinate subtlety that geometry validation meets: child positions are stored relative to their parent, and a renderer that treats them as absolute piles every nested element into the canvas corner. Resolving through the parent chain is the fix, and it comes with obligations of its own. Children must clip to their container or visibly escape it — both are defensible, but pick one, because a child straddling its parent's border reads as a modelling error even when it is a rendering one. The container's own label needs a reserved band the children cannot invade, or deep nesting turns every group title into an unreadable palimpsest. And nested containers compound the arithmetic: a three-level nesting is exactly where "off by one parent" bugs produce output that looks plausibly wrong rather than obviously broken, which is the worst kind of wrong for catching in review.
What to check on every diagram, not one
All three of these share a property: they are invisible on simple diagrams and obvious on complex ones. A rendering pipeline validated against one hand-picked example will ship all three.
A practical check, in order of what it catches:
- Render every diagram, not a sample, and look at the output as images.
- Sort by file size. Anomalies cluster at both ends — near-empty renders at the bottom, label-storms at the top.
- Look specifically at diagrams with containers, swimlanes or nested elements; that is where z-order shows.
- Look at the thumbnail grid as a grid, not one thumbnail at a time.
The last point generalises. Rendering bugs in bulk output are found by looking at the bulk, and the cheapest way to do that is to generate the images and actually open them.
Colour, and what survives the trip
A fourth issue, less severe than the three above but more common: the colours in the modelling tool do not mean what the exporter assumes.
Architects colour diagrams for two different reasons and the export cannot tell them apart. Sometimes colour is semantic — red means at risk, grey means decommissioned — and losing it loses information. Sometimes it is decoration, applied for a particular presentation, and preserving it produces a portal that inherits one meeting's aesthetic choices forever.
There is no automatic answer. What works is deciding deliberately per publication: either honour the model's colours, or apply a consistent layer-based palette and accept that semantic colouring is lost. What does not work is honouring some and not others, which is what happens by default when the exporter reads whatever properties it happens to understand.
Interactive beats accurate
A design decision worth making early: is the exported diagram a picture, or is it a navigable object?
Rendering to an image gives pixel-accurate fidelity — it is the tool's own renderer — and produces something inert. Rendering to SVG loses some notation fidelity and gains links: every shape can be clickable, so a reader who spots something interesting can reach the element behind it.
For a portal whose purpose is to let people answer questions, the second is worth more than the first. Readers rarely complain that a shape's corner radius differs from the tool. They complain constantly that they can see a box and cannot find out anything about it.
From diagram to page: the reading experience
A correctly rendered diagram can still be badly published, because the diagram now lives on a page, and pages impose decisions the modelling tool never faced.
Thumbnails come first. An element page listing the six diagrams an element appears on wants small previews, and the tempting shortcut — CSS-scaling the full SVG — works technically and fails perceptually: a fifty-element view scaled to 200 pixels is noise, and a grid of noise teaches readers to ignore the diagram section entirely. Better thumbnails are honest about their job, which is recognition rather than reading: render them at thumbnail scale with labels dropped below a size threshold, so the reader sees the diagram's shape — that distinctive L of the integration view, the three-lane process — and recognition does the navigation. The full diagram then deserves a full treatment: opened large, with pan and zoom that work with the wheel and with touch, because architecture diagrams are read the way maps are read, by moving around them. A diagram wider than the column it sits in, squeezed to fit and zoomable only by browser controls, is the single most common way a good rendering pipeline ships a bad reading experience.
Loading behaviour matters at portal scale. A package page with twelve inline SVGs, each carrying hundreds of elements, is megabytes of DOM the reader did not ask for; lazy-loading everything below the fold and mounting the interactive viewer only on demand keeps the page honest. And since review packs get printed, give diagrams a print treatment deliberately: full width, page-break protected, labels at a size that survives A4 — the same print discipline the rest of the portal needs, applied to its most information-dense asset.
Finally, the click map. Every shape that represents a model element should link to that element's page, and the linking rewards the earlier geometry care twice over: accurate bounding boxes are also accurate hit targets. This is the feature that converts diagrams from illustrations into navigation, and readers use it more than any menu you will build — the diagram is the mental model they already have, and clicking the box they are looking at is the shortest path from question to answer the portal can offer.
A regression harness, because this will break again
Everything above will be fixed once and broken later — by an EA upgrade that adjusts a stored property, by a stylesheet refactor, by the well-meant improvement to label wrapping that re-breaks nesting. Renderers regress, and a renderer that feeds a weekly unattended pipeline needs its regressions caught by something other than a reader's complaint.
The harness that pays its way is golden-file testing over a fixture model: a small, deliberately nasty repository containing one of everything — every relationship type, a three-level nesting, a swimlane, a connector with custom waypoints, a label engineered to overflow, a shape with no explicit fill. Render it on every build and compare against approved output. Compare geometry rather than pixels where you can — element positions, bounding boxes, path coordinates serialised as data — because geometric diffs survive antialiasing differences and name the failing shape in the failure message. Keep a handful of pixel comparisons anyway for the properties geometry cannot see, fills and fonts among them, with a tolerance and a human-reviewable diff image on failure.
The fixture is also where every bug in this article goes to become permanent knowledge. The day the z-order symptom is diagnosed, a swimlane diagram joins the fixture; the day half-suppressed labels ship, a six-slot label case joins. A rendering pipeline two years old should have a fixture that reads as its scar tissue — and a team that can upgrade EA, re-run the harness, and promote the upgrade the same afternoon, because the fixture said nothing moved. That afternoon is what the harness buys, and it buys it every upgrade, forever.
The checklist to leave with
Everything in this article compresses into a list short enough to pin next to the renderer's source, and long enough to save a release:
- Paint back to front — sequence 1 is front, and swimlanes will teach you this the hard way.
- Suppress connector labels in all six slots, or in none.
- Give every shape an explicit fill; SVG's default is black and thumbnails hide it.
- Measure text with the font you actually serve, and decide the overflow policy on purpose.
- Honour waypoints; route fallbacks around shapes, never through them.
- Implement the full ArchiMate notation table for line ends and styles — arrowheads are semantics.
- Resolve coordinates through the parent chain, and clip children deliberately.
- Decide per publication whether colour is meaning or decoration.
- Render every diagram, sort the output by file size, and look at the extremes.
- Make shapes clickable; the diagram is the navigation readers already understand.
- Keep a fixture model with one of everything, and let every bug you fix join it.
None of these is difficult in isolation, and every one of them has shipped broken in a real portal — usually discovered by a reader, occasionally by an auditor, and in the best cases by the harness at build time, which is the only one of the three that costs nothing. The gap between "the export looks fine" and "the export is correct" is exactly this list, walked once deliberately and then guarded by tests forever.