The morning the telemetry stopped
The organisation manages drinking water production and distribution for a large service area: treatment plants, a network of pumping stations and reservoirs, thousands of sensors feeding readings back to the control room. On the morning in question, a storage failure took down the data historian — the system that collects and stores those sensor readings — and the failover that everyone assumed would catch it did not.
The direct consequences were managed well. Operators fell back to manual procedures, plant staff took local readings, and the water kept flowing. What turned a bad morning into a strategic question was everything else that quietly stopped working. Water quality dashboards went blank. The laboratory's sample scheduling, which read from the same historian, began working from stale data. A regulatory report due that week could not be assembled. A leak-detection analysis that nobody in the control room even knew existed turned out to feed the maintenance planning system. For roughly two days, people across the organisation discovered, one by one, that their work depended on a system they had never heard of.
None of this was anyone's negligence. Each connection to the historian had been a sensible decision at the time it was made, approved by whoever needed to approve it, and documented — if at all — in the project that made it. The organisation's picture of its own dependencies existed only as the sum of a decade of such projects, held in no single place and in no single head.
The incident review handled the storage failure and the broken failover competently — those were engineering problems with engineering answers. The question the review could not answer was the wider one the managing director asked: if this had been the integration platform instead, or the geographic information system, what would have stopped? Nobody knew, and everyone knew that nobody knew.
A question nobody could answer
It was not that the organisation lacked documentation. The CMDB listed servers and their operating systems. Infrastructure kept network diagrams. Application owners maintained their own runbooks. What did not exist anywhere was the vertical picture: which business services depend on which applications, which applications depend on which platforms and infrastructure, and therefore what actually stops when a given piece fails.
The gap has a particular shape in utilities. The operational technology side — SCADA, telemetry, plant control — is documented to engineering standards, because regulation demands it. The business side — billing, planning, laboratory, customer contact — is documented the way office IT usually is, which is to say unevenly. And the connections between the two worlds, which is exactly where the historian sat, belong to nobody and are documented nowhere. The outage had happened precisely on that seam.
We were brought in through our enterprise architecture consulting practice with a deliberately narrow brief: build the dependency picture that would have answered the managing director's question, in Sparx EA, and make it something the organisation can keep current — not a one-off study that is true for a quarter and then decorative.
Choosing where to start
The temptation with dependency mapping is to map everything at once: import everything, connect everything, and produce a model so large that nobody can say whether it is right. We scoped the other way around, starting from the services whose interruption the organisation genuinely fears. With the leadership team we picked five: water quality monitoring, incident and leak response, laboratory analysis, customer billing, and regulatory reporting. Everything in the first phase existed to explain how those five could fail.
That choice had a useful side effect: it made completeness checkable. "Have we captured every application the estate contains" is unanswerable; "have we captured everything these five services touch" can be walked through with the people who run them, service by service, until they stop finding gaps. The five services eventually traced down to around forty applications and a somewhat larger number of technology components — a model a small team can actually maintain, rather than a heroic snapshot.
We also agreed early what the model was not for. It would not hold server inventory detail — the CMDB already did that, and duplicating it would create a second copy to rot. The model's job was the connective tissue the CMDB lacks: the serving and realisation chains from business service down to the platforms that matter, with a reference out to the CMDB record for anything deeper.
Modelling the dependency chains
The structure follows ArchiMate's own grain. Each of the five business services is a business service element. Beneath each, the application services it consumes are linked with serving relationships; application components realise those application services; technology services — database platforms, the integration platform, the telemetry infrastructure — serve the components; and nodes carry the technology services. Where data mattered to the impact story, we added the data objects and access relationships, though we did this sparingly.
Conventions did more for the model's usefulness than any clever structure. One canonical element per application, whatever it is called in different departments — the historian alone went by three names, and we recorded the aliases in a tagged value rather than as separate elements. Every application element carries tagged values for criticality, its governing recovery expectation — the workshops recorded a tolerance per consuming service, and the strictest of them governs the application — the support arrangement with its committed response and restoration times, and the responsible team. Every dependency had to be asserted by someone specific in a workshop or evidenced in an interface document; nothing went in because a diagram somewhere implied it. A dependency model that mixes verified and assumed edges is worse than none, because it fails exactly when it is consulted under pressure.
The repository structure kept a reference package for the canonical elements — applications, technology services, nodes — and one view package per business service, holding its dependency diagrams. Project teams and operations look at the service views; the reference package is where the librarianship happens. We baselined the reference package monthly, so later arguments about "when did this dependency appear" could be answered by comparing baselines rather than by memory.
What the first diagram showed
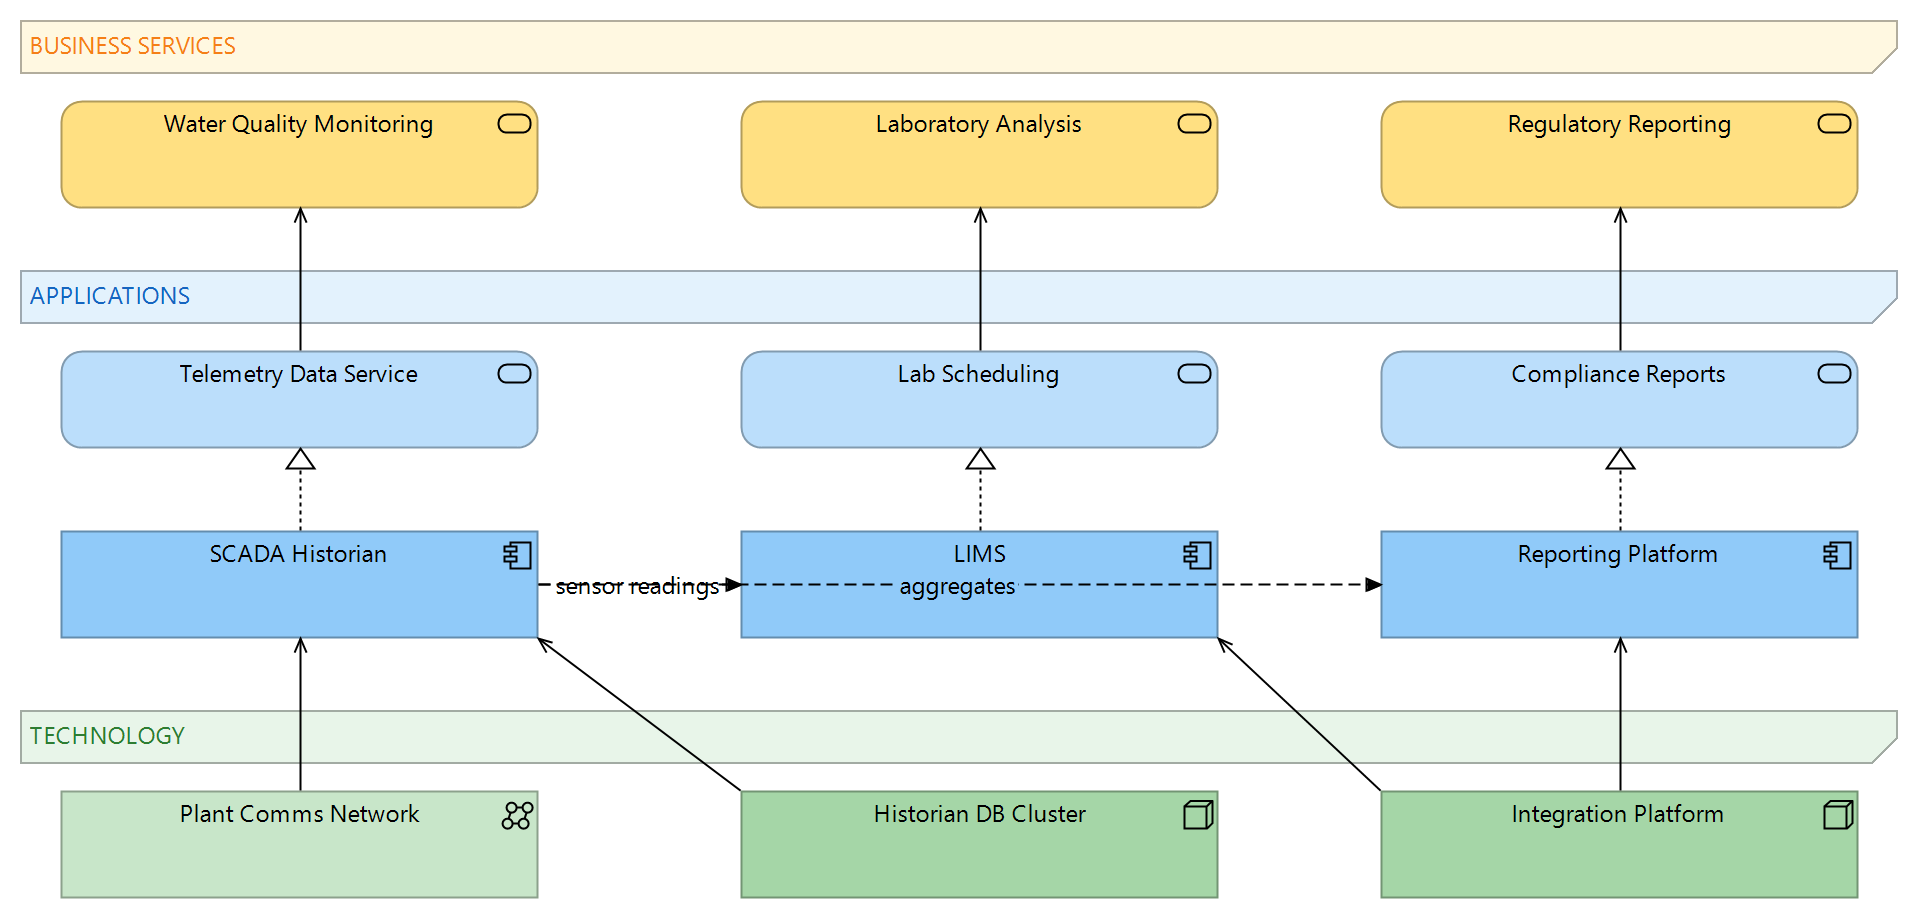
Figure 1 shows the shape that emerged for the telemetry side of the estate, and it explains the outage's surprises at a glance. The historian was not one system among many; it was the quiet centre of the diagram. Water quality monitoring, the laboratory’s scheduling and leak analysis — the three services the figure traces — all ran down to it, as did part of regulatory reporting — some directly, some through the integration platform, which itself turned out to be the second quiet centre. The people who ran the historian knew about the control room and the dashboards. The other consumers had attached themselves over the years, one integration at a time, without anyone maintaining the overall picture.
Showing this diagram to the incident review group produced a long silence. Not because the facts were new — every individual edge was known to someone — but because nobody had ever seen them assembled. The two-day discovery process that the outage had forced on the organisation was, in effect, this diagram being drawn the hard way.
Where the information came from
The model was assembled from three sources, in a deliberate order. First, workshops with the operators of each of the five services, walking from the service downwards: what do you use, what does it use, what happens when it is gone. These sessions produced the skeleton and, more importantly, the recovery expectations — how long each service can tolerate losing each dependency, which turned out to vary far more than the official criticality ratings suggested.
Second, the CMDB. We exported its application and server records to CSV and loaded them through a script against the Sparx EA automation API, matching on names and recording the CMDB identifier in a tagged value on each element. The match rate on the first pass was poor — around two thirds — almost entirely because of naming drift between what departments call systems and what the CMDB calls them. Reconciling the rest by hand was tedious and valuable in equal measure; most of the unmatched CMDB records turned out to be retired systems still listed, while the comparison run the other way — model elements with no CMDB match — surfaced live systems the CMDB had never heard of, and both lists went straight to the CMDB owner as findings.
Third, interface documentation and the integration platform's own configuration, which we used to verify the edges the workshops had asserted. Where the platform's routing tables showed a flow nobody had mentioned, it went back to the next workshop as a question. Half a dozen dependencies entered the model this way, including the leak-analysis feed that had surprised everyone during the outage.
Modelling up to the operational technology boundary
A water utility's estate has a line running through it that most sectors do not have to think about: the boundary between office IT and the operational technology that runs plants and pumps. Early in the engagement we had to decide how far across that line the model would go, and the answer we settled on was: to the boundary, and one element beyond it, and no further.
The reasoning was partly about usefulness and partly about safety. On the usefulness side, the impact questions the organisation wanted answered all lived on the IT side of the seam — the plant control systems have their own engineering documentation, their own change regime and their own regulator, and a business-oriented repository was never going to compete with that. On the safety side, the OT engineers were understandably wary of their systems being described, however abstractly, in a repository with broader read access than their own documentation. Detailed topology of control systems is exactly the kind of information an organisation should not scatter.
So the model represents the OT world as a small set of coarse elements — the telemetry acquisition service, the plant control environment — with the dependency edges that cross the seam drawn carefully and verified with the OT team, and everything deeper left to the engineering documentation, referenced by tagged value. The historian sits, as it does in reality, with one foot on each side. The OT engineers reviewed exactly what the repository would say about their world and signed it off, which cost us one extra session and bought the model something more valuable: their willingness to keep those few edges honest over time, since they were edges they had agreed to.
The decision also settled who may change what. Package-level security in Sparx EA keeps the service views broadly readable while the reference package is writable only by the architecture team — a coarse mechanism, but sufficient for a model that deliberately stops at the boundary rather than describing what lies beyond it.
Asking impact questions of the model
A dependency model pays its way through the questions it can answer on demand, so we invested in making the impact question a routine operation rather than a modelling exercise. For interactive use, Sparx EA's Insert Related Elements does the core of it: start from any node or technology service, pull in everything the failed element serves or realises — following the relationship direction upwards, not every connection — to a chosen depth, and the impact picture assembles itself on a fresh diagram in a few minutes. The Traceability window gives the same answer as a tree when a diagram is more than the question needs.
For the questions the organisation asks repeatedly, we saved model searches: everything within two serving hops of a named technology component; every business service whose chain includes a given node; every application whose governing recovery expectation is tighter than the committed restoration time of something beneath it. That last search — expectation versus arrangement — became the most consequential artefact of the engagement, and it is a plain SQL query over relationships and tagged values, run in seconds.
The test we set ourselves: the question the managing director asked after the outage — "if the integration platform fails, what stops?" — had to be answerable in under five minutes, by a member of the client's own team, from the repository. By the end of the engagement it was a saved search and a diagram away.
Single points of failure, made visible
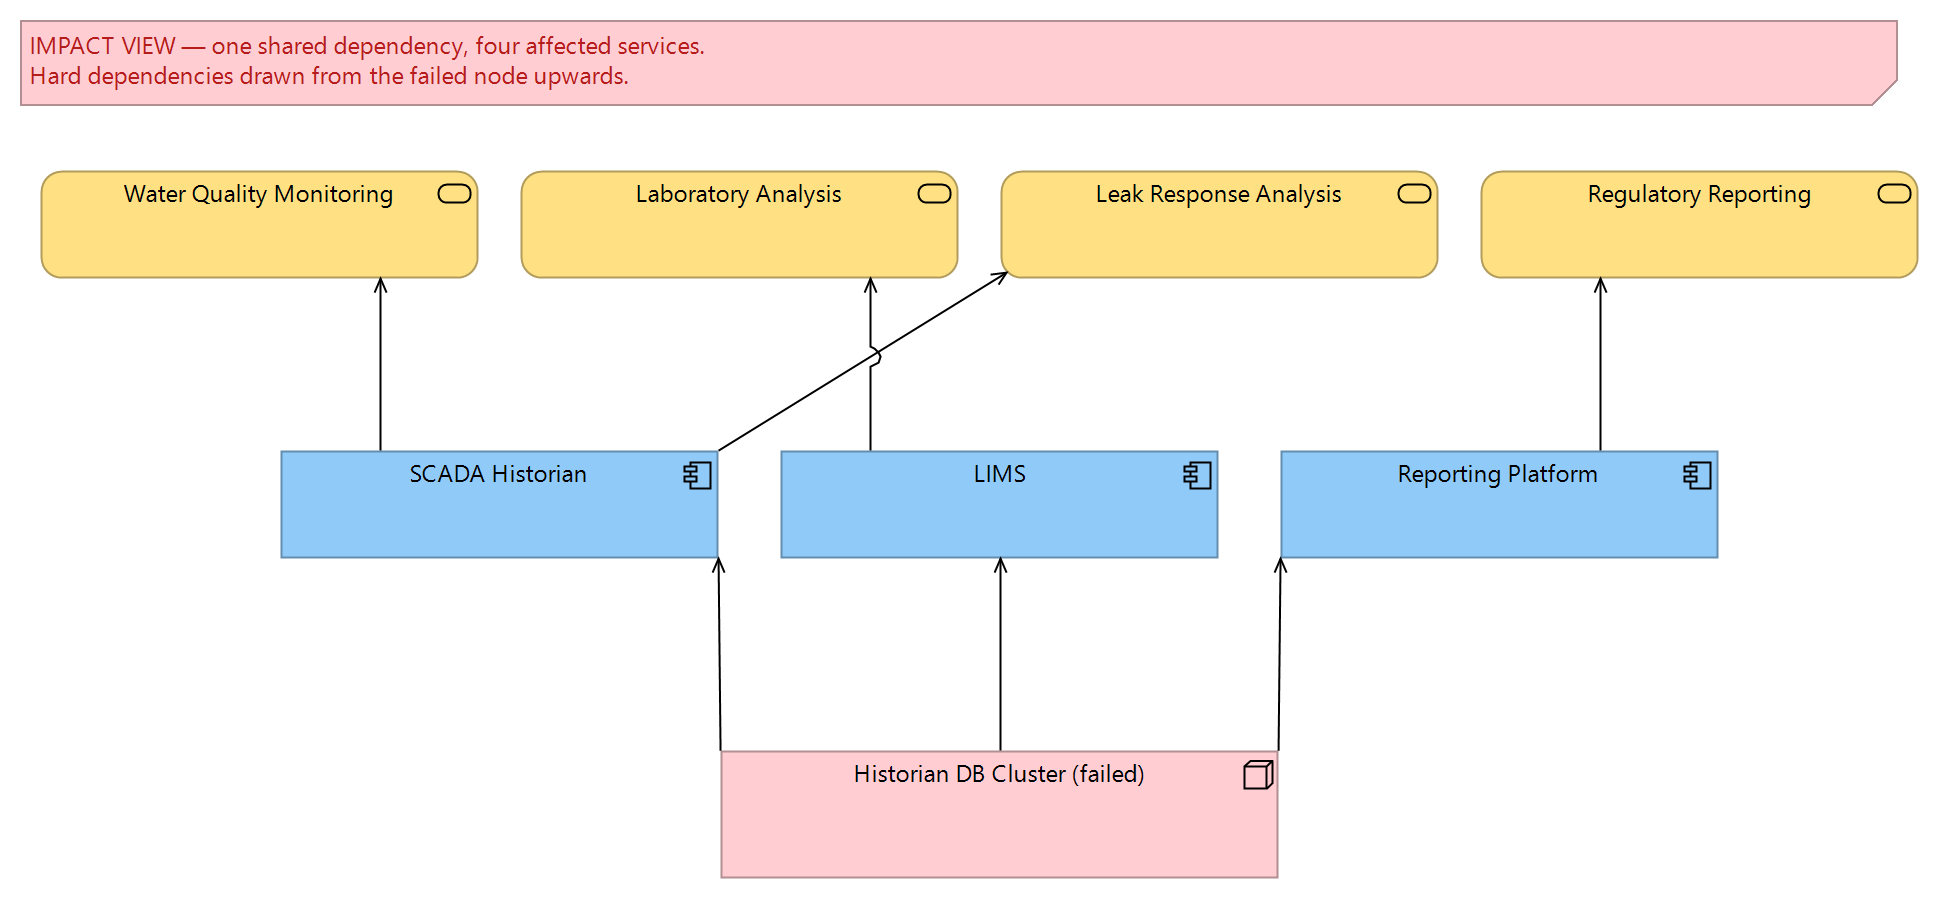
Figure 2 is the view that changed the investment conversation: a single shared component at the bottom, and the fan of everything above it that stops or degrades when it fails. Prepared for the historian, the integration platform and the geographic information system in turn, these views made the concentration risk in the estate legible to people who will never open a modelling tool. Three components carried most of the five critical services between them, and only one of the three had a failover arrangement that had ever been tested — a sentence that had been true for years without being visible to anyone who could act on it.
We were careful about what the views claim. A fan-out shows exposure, not certainty: some consumers degrade gracefully, some stop dead, and the diagram cannot tell the difference by itself. So each edge in the critical chains carries a tagged value distinguishing hard dependency from degraded operation, set in the workshops by the people who run the service, and the impact views colour the two differently. The distinction is exactly what a recovery discussion needs and exactly what a raw dependency crawl cannot provide.
From model to recovery planning
The model then fed the organisation's recovery planning in three concrete ways. The mismatch list came first: services whose owners expected recovery in hours sitting on components with next-business-day support contracts. There were more of these than anyone was comfortable with, and each one is a decision — raise the support arrangement, engineer redundancy, or lower the expectation honestly and plan the manual fallback properly. The list went to the operations board with the model views attached, and worked through over two quarters.
Second, recovery sequence. When multiple services share a failed component, something must come back first. The dependency chains, together with the criticality tagged values, gave the control room a defensible restore order per scenario instead of the improvised one the outage had produced. These sequences now live in the recovery runbooks, with the generating views referenced, and the runbook review cycle includes checking the views still match reality.
Third, exercise design. The organisation runs periodic continuity exercises, and the scenarios had always been chosen by intuition. The impact views gave the exercise planners a shortlist ranked by blast radius — and the first exercise built from the model deliberately took down the integration platform on paper, which found two runbook gaps the real outage had not.
Keeping the model alive
A dependency model is a photograph of a moving thing, and we were direct with the client about that limitation from the first workshop. Two mechanisms keep this one from quietly rotting. A scheduled script re-runs the CMDB reconciliation monthly, flagging new, changed and retired records against the model's tagged identifiers; discrepancies go to a named owner in the architecture team, and the exception list is reviewed in the same meeting that reviews change requests. And any change that adds or removes an integration is expected to update the affected service views before closure — a rule the change board agreed to enforce, which is worth more than any tooling.
What the mechanisms cannot do is discover the unknown. Sparx EA is a repository, not a scanner: a dependency nobody declares and no configuration reveals stays invisible until an incident or an audit finds it, exactly as the leak-analysis feed once was. We said this plainly in the closing report. The model assembled what was known but scattered; the unknown edges shrink only as evidence accumulates, and claiming otherwise would set the model up to be blamed for the next surprise. The client chose to complement the model with periodic traffic analysis on the integration platform, feeding anything unexplained back as workshop questions — the right division of labour between evidence and repository. The database platform behind the repository, for what it is worth, is PostgreSQL, following the guidance in our article on choosing a database for Sparx EA repositories.
Handing the model over
From the midpoint of the engagement onwards, the client's two architects did the modelling and we reviewed, rather than the other way round. The handover artefacts were deliberately few: a two-page modelling guideline naming the element types, relationship directions and tagged values in use; the saved searches; the reconciliation script with its schedule; and the reference views as worked examples. Long guideline documents do not survive contact with staff turnover; a repository whose existing content demonstrates the pattern does.
For the operations board, we set up a document template that generates a quarterly dependency report — each critical service, its chain, its open mismatches — straight from the repository, so the board sees current model content rather than a slide deck that was true when it was written. The first quarter's report was assembled by the client team in an afternoon. The measure of a handover is whether the second report happens without prompting; it did.
Where they are now
A year on, the model covers seven services — the original five plus two the operations board asked to add — and the monthly reconciliation runs without our involvement. The impact views are a standing input to the continuity programme, and the mismatch search runs before every support contract renewal, which has quietly changed how those negotiations go. The historian, for the record, now has a tested failover.
The strongest sign the work has taken root is behavioural: when a new integration is proposed, the first question in the design review is now "show me where it lands in the service views". The organisation did not become immune to outages — no model does that — but for any dependency the model holds, the impact of the next failure reads off a diagram in minutes rather than being discovered across the organisation over two days.
If parts of this are familiar — an estate that keeps working until the day it visibly does not, and no assembled picture of what depends on what — you can reach us through our contact page.
This case study describes a representative engagement pattern. Organisational details are illustrative and do not identify a specific client.