The questions the repository could not answer quickly
The client in this case manages commercial property — offices, retail space and the services around them — across Belgium and its neighbours. Its IT estate is modest by banking standards, around two hundred applications, but it carries the full weight of the business: lease administration, facility management, energy monitoring, tenant portals, and a finance core that everything eventually touches. The architecture team is three people, and they had spent two years building a genuinely decent Sparx EA repository: applications catalogued, a capability model agreed with the business, integrations documented.
The trouble was the last mile. Every quarter, the CIO took an IT review to the management board, and every quarter the same questions came back: which applications have no clear owner, which are approaching the end of vendor support, where are we thin — capabilities the business depends on with only one ageing system under them, or none. The repository contained most of the raw material to answer all of this. It just could not produce the answers in a form a board would read, and so, every quarter, one of the three architects stopped being an architect for two weeks and became a slide factory.
A quarterly report assembled by hand
We asked to see the previous quarter's production process before proposing anything, and it was the familiar assembly line. Exports from the repository into Excel; a manual join against a support-contract list from procurement; colour-coding by hand; charts rebuilt in PowerPoint because last quarter's file had broken links; and a final week of checking, because a board member had once caught a dead application listed as live, and the team had been over-verifying ever since — the memory of one bad number was costing them days every quarter.
Two things about this process struck us as fixable in a way that would stick. First, almost every manual step was a query in disguise — "applications without an owner" is not analysis, it is a filter, and filters belong in the tool that holds the data. Second, the report's credibility problem and its cost problem had the same root: numbers copied between tools drift, and drifting numbers get caught in board meetings. Producing the report from the repository, with no copies, attacks both at once. This is the reporting cousin of what we tell clients about document generation from the model: the document is a view, not a product, and the moment it is edited by hand it starts to rot.
Checking whether the data could carry a report
A report is only as good as the attributes under it, so before building anything we profiled the repository the unglamorous way: scripted queries over the element tables, counting how completely the reporting-relevant properties were actually filled. The result was a mixed and useful picture. The application catalogue itself was strong — the team's two years of work showed. Ownership was recorded for roughly half the applications, but in three different ways: a tagged value here, a linked business role there, free text in notes elsewhere. Lifecycle information existed mostly where a project had recently touched a system. Support-end dates lived in procurement's contract list and not in the repository at all — a list that mixes two dates worth keeping apart, contract expiry and the vendor's end of support; the report tracks the vendor's date, and the import maps that column deliberately.
The profiling itself is worth a paragraph, because it is the step teams skip and regret. We ran a dozen read-only queries against the element and tagged-value tables — coverage per property, distinct values per property, and a cross-tabulation of ownership convention by package, which is how the three competing conventions became visible as a fact rather than a suspicion. Each query took minutes to write; together they replaced what would otherwise have been weeks of discovering the gaps one board question at a time. We also time-boxed it hard: profiling is reconnaissance, and reconnaissance that lasts a month is procrastination. Ours took four days, including writing up, and the write-up itself was two pages: one of findings, one of what the first report could therefore honestly promise.
We put this profile in front of the CIO as a one-page statement of what the first report could honestly contain, and — just as important — what it could not yet. That framing turned out to matter enormously. Instead of promising a complete report and quietly padding the gaps, the first generated report would show the gaps as content: missing ownership is not a blemish on the report, it is one of the report's findings. The CIO, to his credit, preferred an honest sparse report to a polished fiction, and that decision set the tone for everything after.
Agreeing the reporting attributes
The repository needed a small, stable set of attributes that the report would stand on, and the temptation to standardise everything at once had to be resisted. We ran two working sessions with the architecture team and settled on a reporting profile of six tagged values on application components: owner (a name from the organisation directory, not free text), lifecycle status from a closed list, support-end date, criticality from a closed list, hosting model, and a date-verified stamp recording when a human last confirmed the entry. Everything else the team wanted to standardise went on a someday list, deliberately.
The three existing ownership conventions were consolidated by script into one convention — the tagged value, with the linked-role variant kept as the structured source where it existed. Procurement's support-end dates were imported once by matching contract rows to applications, and then, rather than repeating that import forever, procurement agreed to a quarterly file drop the script consumes. A validation script — the same pattern we describe in our work on model validation — runs weekly and writes a short exception list: closed-list values misspelt, owners not found in the directory, verified stamps older than a year. The team fixes exceptions in minutes weekly instead of days quarterly, which is the entire trick of repository quality: move the correction next to the change.
Model searches as the reporting backbone
With the attributes agreed, the report became a set of saved model searches, most written as SQL against the repository, each answering exactly one board question and named accordingly. Applications with no owner. Applications whose support ends within eighteen months, soonest first. Applications marked critical whose verified stamp has lapsed. Capabilities with no supporting application, and capabilities supported only by applications in decline. Applications supporting no capability at all — the reverse question, which finds the systems nobody will admit to.
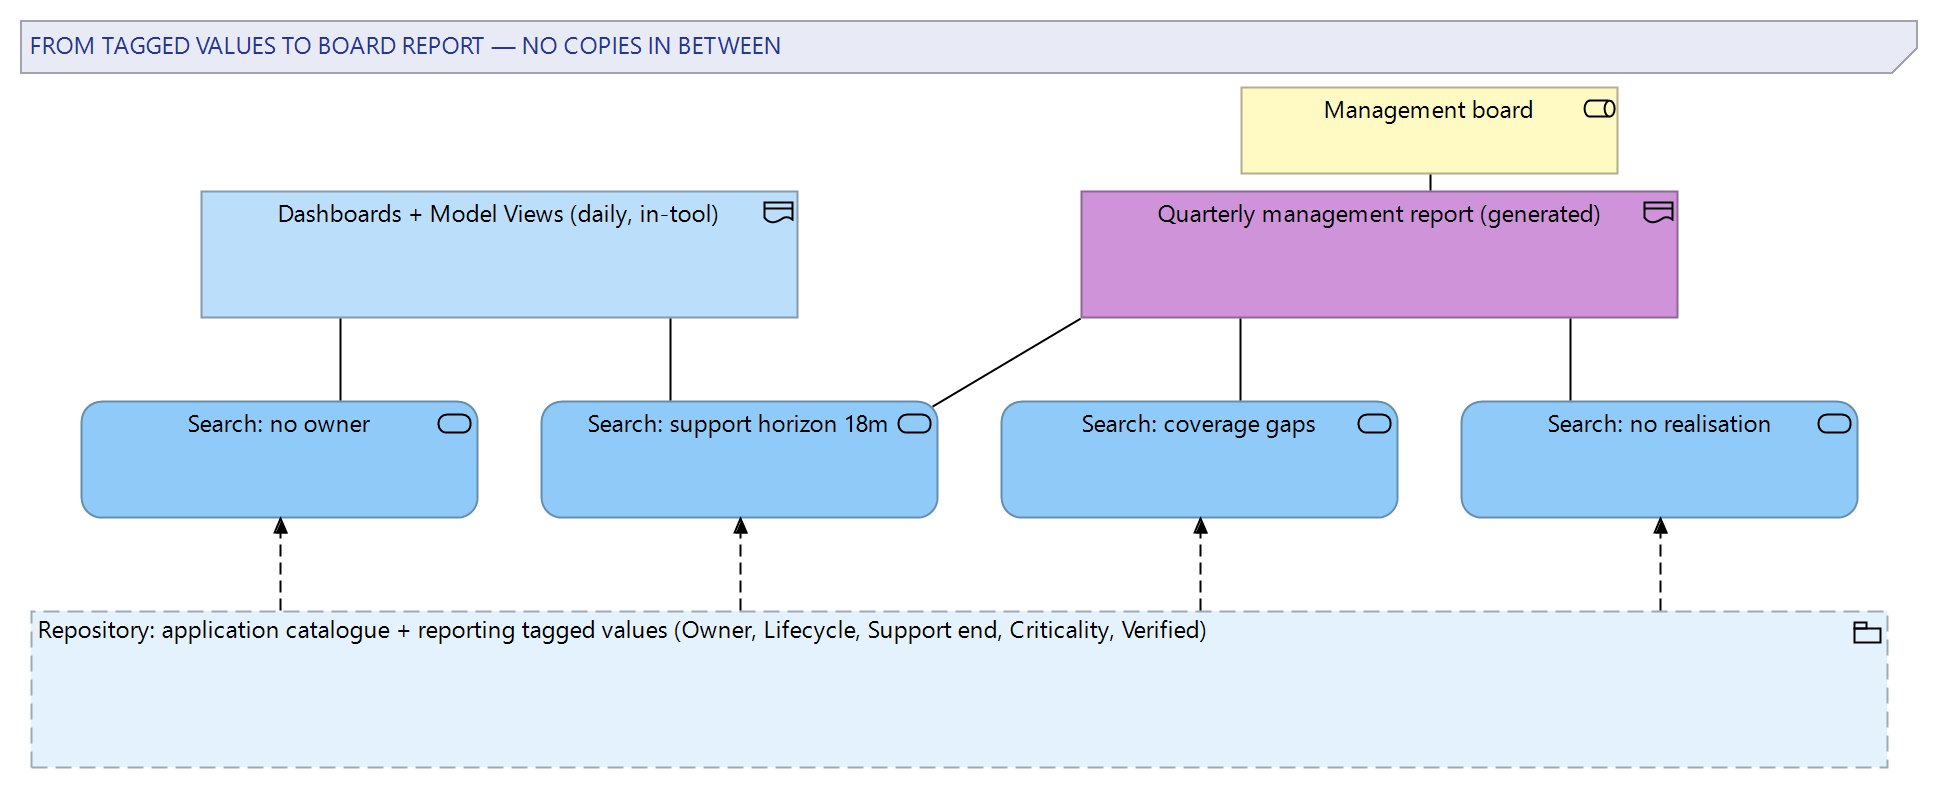
Keeping each search single-purpose was a deliberate design rule. A search that answers one question can be named after the question, checked by eye against a handful of known cases, and reused anywhere — in the tool, in the generated report, in an ad-hoc answer to the CIO on a Tuesday. Composite searches that try to be the whole report in one result set become unmaintainable within a year, and unmaintained queries are how reporting quietly returns to Excel. One storage detail is worth knowing: Sparx EA keeps user-defined searches per machine rather than in the shared repository, so the search definitions were exported to XML and kept in version control alongside their SQL — with a line of comment per query stating the board question it exists to answer — and imported on each architect's client. For a team of three that is a two-minute step; a larger team would fold the searches into an MDG Technology and be done with it.
Reporting views inside the tool
Between the weekly exception list and the quarterly board report sits the daily view, and for that we used what Sparx EA already offers rather than building anything: a dashboard diagram per concern using the standard chart elements, and Model Views giving the team live listings of the exception searches. One discipline keeps this layer trustworthy: a chart element in EA carries its own SQL rather than referencing a saved search, so both charts and searches are generated from the same version-controlled SQL files — without that, the chart and the search it supposedly mirrors drift apart within months. The dashboards show the shape of the estate — lifecycle mix, support-end horizon, criticality spread — and they update from the searches, so they track the repository itself rather than a copy of it — as current as the data underneath, which for the procurement feed means the most recent quarterly drop.
The team wrapped a small ritual around this layer, and the ritual matters as much as the tooling. Monday mornings, twenty minutes, the three architects walk the exception Model Views together and assign anything new. It replaced no meeting — it was simply added and kept because it stayed short — and it is the reason the weekly exception list trends towards zero instead of accumulating. Tooling that surfaces problems without a habit that clears them just produces better-documented neglect; the habit is where the quality actually comes from.
We are measured about this layer, because the charts are serviceable rather than beautiful, and we told the client so. Their styling options are limited, and a design-conscious communications team will not love them. Their virtue is different: they are inside the tool, on the data, with zero export steps, and for an architecture team of three the absence of moving parts is worth more than visual polish. The polish is applied exactly once per quarter, in the generated report, where it belongs.
The capability coverage view
The board question that needed more than a list was coverage: where the business is thin. The capability model gave us the rows; the realisation links from applications gave us the fill. We generated a coverage view per business domain — capabilities as a grid, each carrying its support summary derived from the searches: how many applications realise it, their worst lifecycle status, and whether anything supporting it appears on the support-end horizon.
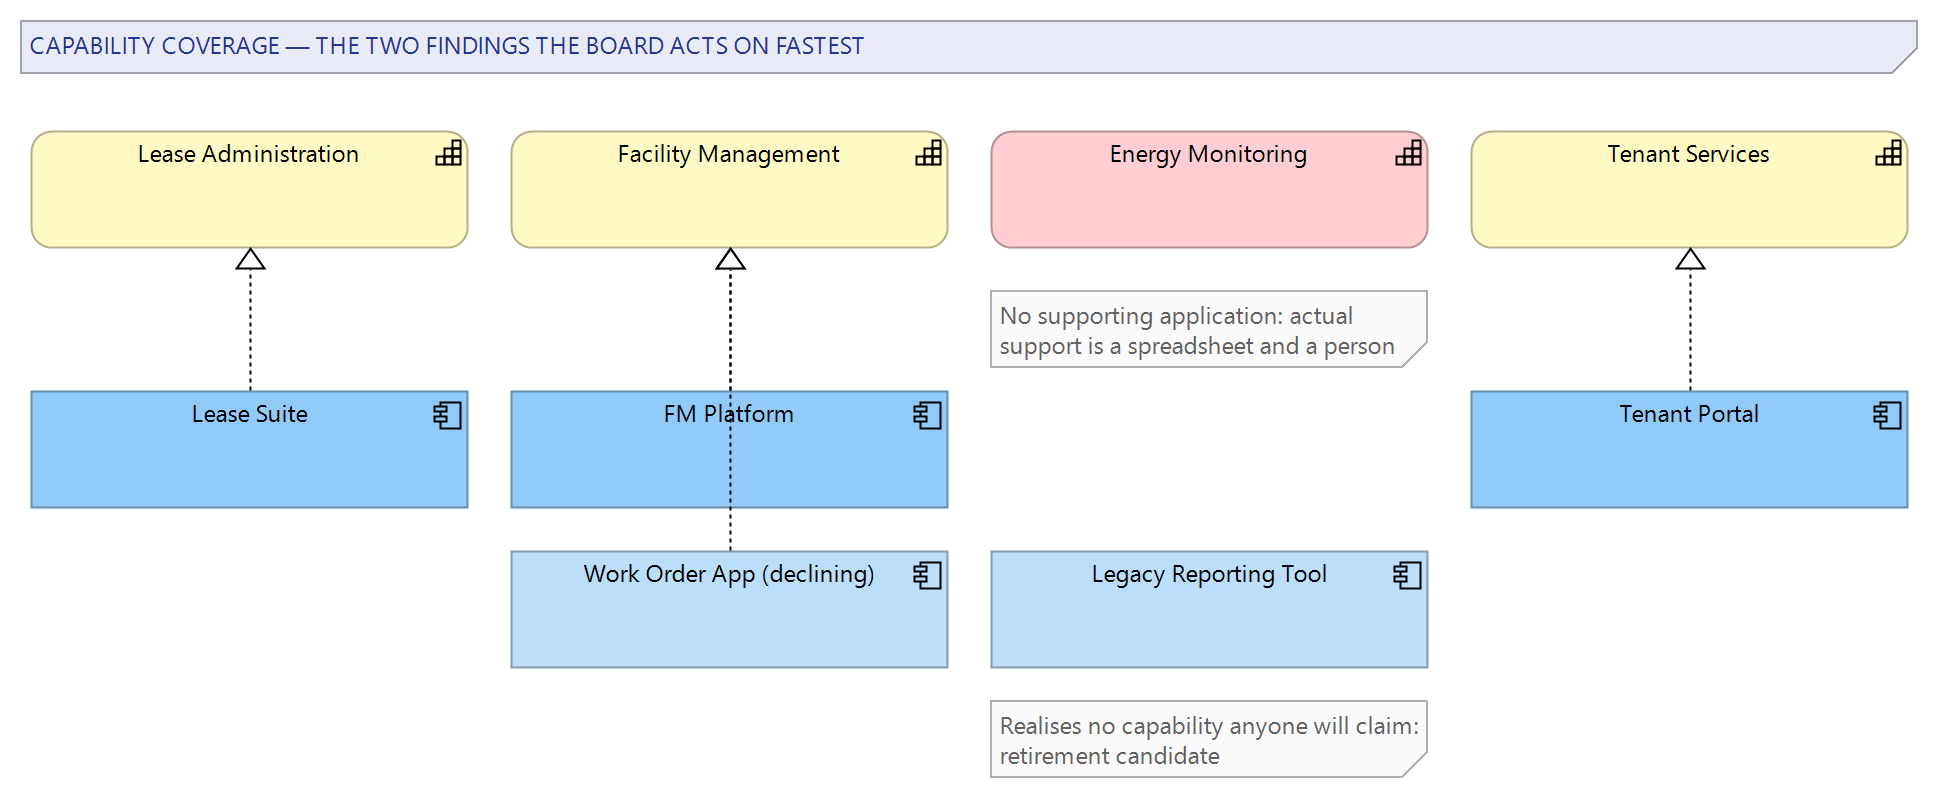
Every empty cell was checked with its domain owner before the view reached the board — an empty cell can mean missing modelling as easily as missing support, and two first-pass gaps were exactly that. What survived the check was what these views always find: a capability the business called essential with nothing under it — its actual support was a spreadsheet and a person — and a cluster of applications realising no capability anyone would claim. Both became board items within two quarters, one as an investment case, the other as the start of a retirement list. We have written elsewhere about building capability maps that connect strategy to execution; this engagement was the payoff end of that work, where the map stops being a wall poster and starts allocating money.
Generating the management report
The quarterly report itself is generated through Sparx EA's document engine: a template whose sections are driven by the saved searches, with template fragments handling the per-domain coverage pages, producing a document in the client's own layout. The front section is written by a human — the CIO's narrative, judgements and asks belong to the CIO, and no generator should pretend otherwise. Everything after it is generated: the exception lists, the support-end horizon, the coverage pages, and an appendix stating the generation date, the repository baseline it ran against, and the count of entries carrying a lapsed verification stamp, so the board always knows how current its evidence is.
Getting the template right took about a week and a half, most of it in the fragments' SQL and in convincing the layout to respect the corporate document standard. Since then, production of the evidence half of the report has gone from two weeks of an architect's quarter to a generation run and a morning of reading the result before it ships. The reading morning is kept on purpose: a human looks at every generated report before the board does, not to fix numbers — there is nothing to fix that is not a repository fix — but to catch the finding that needs a sentence of context before a board member reads it cold.
One rule keeps the whole system honest: nobody edits a number in the document. If a number is wrong, the repository is wrong, and the fix happens there — visible to the next search, the next dashboard, and the next quarter. The first time an executive asked for "a quick correction in the report", declining it politely was the most important architectural decision of the month.
Teaching the report to defend itself
A board report lives or dies on the first challenged number, so we spent deliberate effort on what happens when someone says "that can't be right". The design answer is that every figure in the report traces to a named search, every search reads the live repository, and every listed application carries its verification stamp — so a challenge decomposes, in front of the challenger, into one of exactly three cases. Either the repository is wrong, in which case the fix is made in the repository and flows into everything generated from that moment on — the already-issued document is not silently rewritten, and a correction that matters at board level goes out as a regenerated page with a note; or the repository is right and the challenger's picture is stale, which the verified stamp and the owner's name usually settle quickly; or the question was subtly different from the one the search answers, which is a conversation worth having and occasionally the birth of a new search. And rarest but real: the reporting machinery itself is wrong — a join, a filter, a template fragment — which is what the reading morning and the weekly checks exist to catch, and twice in the first year that was the answer.
The CIO took to handling challenges live: opening the relevant search result in the meeting, or asking the architecture team to do so, rather than promising to check offline. The first two live resolutions changed the board's relationship with the report in a way no accuracy statistic could have. A report that can show its working, immediately, stops being the IT department's claim and starts being shared evidence — and afterwards, board members began phrasing requests as "can there be a view that shows…", which told us the audience had started to trust the instrument.
The working set the report stands on is small enough to list, and keeping it small is a maintained discipline rather than an accident:
| Board question | Named search | Who acts on it |
|---|---|---|
| Which applications lack a clear owner? | Applications — no owner | Department heads |
| What is reaching end of support? | Support horizon, 18 months | Procurement and architecture |
| Where are we thin on capability support? | Coverage — unsupported or fragile | Investment committee |
| What do we run that serves no capability? | Applications — no realisation | Retirement candidate list |
| Which critical entries are stale? | Critical — verification lapsed | Architecture team, weekly |
The first quarter on the new report
The first board meeting with the generated report was, by design, partly a meeting about gaps. Around a third of applications still had no confirmed owner, and the report said so in a table rather than hiding it. The effect surprised even us: within six weeks, ownership completeness climbed steeply, because the missing-owner list had names of department heads implicitly attached, and nobody wanted to headline the next quarter's list — accountability travelled through the report without a single escalation email being written. A report generated from the repository turned out to be the strongest data-quality instrument the team had ever deployed — stronger than any validation script, because the audience was the board.
The second quarter settled into the intended rhythm. The architecture team spends its recovered time on architecture; the weekly exception list keeps drift small; procurement's file drop arrives without chasing; and board questions increasingly come back between meetings as requests the team can answer with an existing search, or a new one that takes an hour and then joins the library. The report has also started travelling: the audit function asked for the support-end horizon as a standing feed, and got it as a scheduled export of the same search — one more consumer, zero new numbers.
By year end the report had acquired the best kind of institutional weight: the board scheduled its annual portfolio investment discussion to fall two weeks after the Q4 generation, so the decisions would sit on fresh evidence. Nobody announced that as a milestone, and it was one — the point where the repository stopped being the architecture team's tool and became part of how the company decides where money goes.
Where tool reporting stops
Sparx EA carried this engagement further than many would expect, and it is worth being precise about where it stopped. It stopped at trends. The searches and dashboards report the estate as it is now; the board, after two good quarters, began asking how the numbers are moving — is ownership completeness improving, is the ageing curve flattening. EA does offer Time Series charts, which can record a query's results on a schedule, and for an in-tool trend view they are the native answer. We chose a generation-time archive instead — a small script writes each quarter's key search results to CSV — because the board's trend questions were anchored to the quarterly reports, and the archive doubles as the record that makes any past report's numbers reproducible. The honest edge stands either way: history exists because something was configured to record it, and a trend you never captured cannot be reconstructed later.
A middle ground we did deploy is WebEA read access for a handful of managers who wanted to browse between quarters — the coverage views and dashboards are reachable in a browser, without a modelling licence, and for perhaps a dozen people that closed the gap between the quarterly document and the daily tool. It comes with its own honesty note: WebEA shows the model as it is, not as it was at the last report, and we made sure the browsing managers understood they were looking at a live working repository, not a published baseline. For this organisation's size, that trade was acceptable; at larger scale, the distinction between a working model and a published view becomes a real governance line, and deserves proper machinery.
The other boundary is presentational. For audiences beyond the board — a wider management layer that will never open a modelling client — a generated document is the right vehicle, but organisations with bigger audiences often want a browsable portal over the same content, and that is a different engineering problem with different trade-offs. Where a client's ambitions point that way, we scope it as its own piece of work rather than stretching the document engine past what it is good at.
If your repository is full of answers your management never sees — or your quarterly reporting still runs on exports and evenings — this is a pattern we have built more than once, and our Sparx EA consulting team can help you judge whether your data is ready for it. A good first step is our Sparx EA maturity assessment, or simply a conversation via our contact page.
This case study describes a representative engagement pattern. Organisational details are illustrative and do not identify a specific client.