A budget round that went nowhere
The engagement began, as these things often do, with a meeting that went badly. A distribution network operator — around eighteen hundred people, responsible for electricity and gas networks across a large part of the country — had just finished its annual investment round. Business units had submitted funding requests application by application. IT had brought its own list, ranked by technical urgency. Finance had a third list, ranked by cost. The board looked at three lists that shared almost no vocabulary, funded the items everyone could agree were unavoidable, and deferred the rest to a follow-up meeting that everybody knew would go the same way.
The CIO's frustration was specific: it was not that the organisation lacked information about its applications, but that none of the information connected to anything the board recognised as the business. An application called something like "MDM-2" would be described as end-of-life and in urgent need of replacement, and a board member responsible for customer operations had no way of judging whether that mattered more or less than the six other urgent things on the page.
There had been two previous attempts to fix this. A capability map existed in PowerPoint, drawn by a consultancy some years earlier; it was two reorganisations out of date and nobody could say which version was current. And there was a spreadsheet mapping applications to departments, which answered the wrong question — departments move, merge and rename, which is precisely why capability maps exist in the first place.
We were asked a narrow question: could the next investment round be argued on a shared picture? We suggested a slightly different framing. The picture was the easy part. The work was getting business and IT to agree what the organisation actually does, at a level of abstraction stable enough to hang investment decisions on — and then keeping that agreement alive somewhere more durable than a slide deck.
What we proposed instead
We proposed a series of facilitated workshops to build a capability map directly in Sparx Enterprise Architect, followed by a mapping of the application portfolio onto it, and finally a set of investment views generated from the model for the portfolio board. Six workshops over roughly ten weeks, with the map living in the organisation's existing Sparx EA repository from day one.
The choice to model rather than draw deserves a word, because it shaped everything that followed. A capability map in a drawing tool is an artefact; a capability map in a repository is a reference point that other things can attach to. The organisation already had a partial application inventory in Sparx EA, imported from its CMDB during an earlier exercise. Building the capability map in the same repository meant the connection between capabilities and applications could be a real, queryable relationship rather than a naming convention in a spreadsheet — and it meant the views the board would see could be regenerated whenever either side changed.
We were equally clear about what the map would not be. A capability map does not make decisions; it gives decisions a shared address. We have watched organisations spend months polishing capability definitions in search of a map so precise it answers questions by itself, and that map does not exist. We set the expectation early that the deliverable was a working instrument for an investment conversation, reviewed and refreshed on a cadence, not a monument. This framing, borrowed from our broader enterprise architecture consulting practice, turned out to matter as much as any modelling decision.
Setting up the model before the first workshop
Before the first workshop we prepared the repository so that facilitation could happen live in the tool rather than on sticky notes transcribed later. We created a dedicated package structure — a Strategy area holding the capability model, separated from the existing application inventory packages — and agreed the modelling conventions with the two in-house architects who would inherit the model.
Capabilities were modelled as ArchiMate Capability elements, structured with composition relationships into levels. We fixed the level discipline in advance because it is the single most common way capability mapping goes wrong: twelve capabilities at level one, somewhere between fifty and seventy at level two, and no level three except where an investment decision demonstrably needed it. Level three is where capability maps go to die; every hour spent debating the decomposition of "Corporate Support" is an hour not spent on the four capabilities the strategy actually touches.
Each capability carried a small set of tagged values agreed up front: a one-sentence definition, a business owner, and two assessment fields — criticality and current fitness — that would be filled during the later workshops. We kept the set deliberately small. Tagged values that nobody maintains are worse than no tagged values, because they look like information.
We also settled naming rules that sound trivial and are not. Capabilities are named as noun phrases for what the organisation must be able to do — "Outage Management", "Meter Data Management" — never as departments, systems or projects. The test we used in the room: if a reorganisation tomorrow would force a rename, it is not a capability. That one sentence resolved perhaps a third of all naming arguments before they started.
Six workshops, one map
| Workshop | Focus | Output in the repository |
|---|---|---|
| 1–2 | Level-one map and definitions | Twelve capabilities with agreed one-sentence definitions |
| 3–4 | Level-two decomposition, per business area | Sixty-odd level-two capabilities under composition |
| 5–6 | Criticality and fitness assessment | Scores in tagged values, vote date recorded |
The workshop series ran every fortnight, half a day each, with a deliberately mixed room: the heads of the main business units, the two architects, a finance representative from the third session onwards, and one of us facilitating while the other modelled live in Sparx EA, projected on the wall. Modelling live was a considered choice. When a disputed capability is renamed on screen and the composition moves with it, the group sees that the map is theirs to change — and sees the cost of changing it, which encourages a certain discipline.
The first two workshops produced the level-one map, and they were the hardest. The arguments were never really about names; they were about the organisation's self-image. Whether "Metering" was a capability in its own right or a child of "Network Operations" was, underneath, a question about whether the metering department's transformation programme deserved its own line of sight to the board. We parked the political questions visibly — a parking-lot package in the model, reviewed at the end of each session — and kept the room on the definitional ones.
One dispute is worth retelling because of how it resolved. Field workforce scheduling was claimed by two level-one candidates — operations saw it as part of "Network Operations", the asset side as part of "Asset Management" — and the argument circled for twenty minutes until someone applied the reorganisation test out loud: the schedulers had in fact moved between those two departments twice in a decade, while the thing they did had not changed at all. That settled it as a capability in its own right, "Field Workforce Management", and more usefully it taught the room the test. For the rest of the series, participants policed each other's proposals with it, which is the moment a facilitated exercise starts to become a practice.
Workshops three and four decomposed to level two, one business area at a time, using the definitions written in workshop one as the referee. Between sessions we tidied the model, resolved diagram layout, and circulated a one-page extract per business unit generated from the repository, so that review happened against the real model rather than against memory.
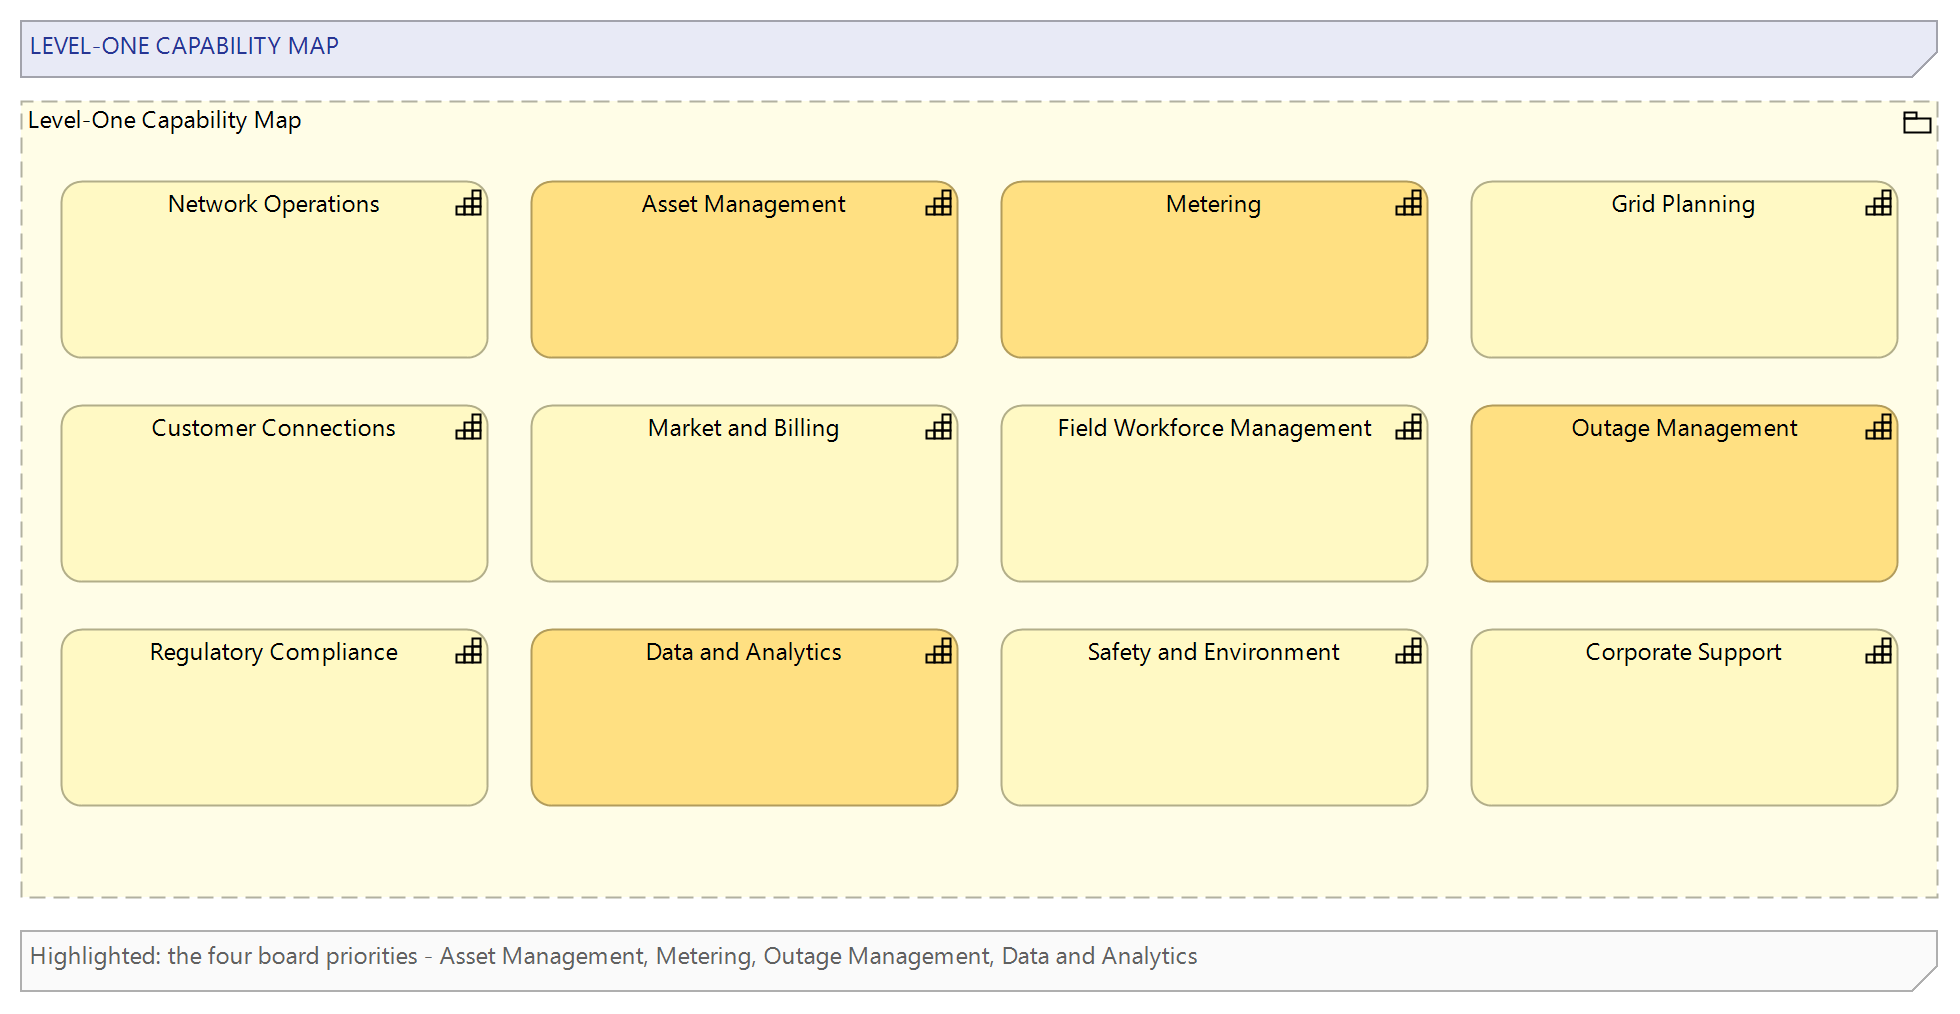
The final two workshops were assessment sessions. For each level-two capability the room scored criticality to strategy and fitness of current support, by structured vote, and we recorded the scores in the tagged values prepared for them. We are candid with clients that these scores are collective judgement, not measurement — their value is that the judgement is made once, in the open, by people who have to defend it, rather than separately in six budget submissions.
Mapping applications to capabilities
The second phase connected the map to the application portfolio, and it began with a cleanup. The CMDB import had left around two hundred and thirty application records in the repository, of which a fair number were duplicates, infrastructure components misfiled as applications, or systems retired years earlier. Working with the architects, we consolidated this to just over one hundred and ninety applications with an agreed definition of what counts as one — itself a workshop's worth of argument in some organisations, settled here in an afternoon.
Each application was then linked to the level-two capabilities it supports. We recorded the links as association relationships with a stereotype and a strength attribute distinguishing primary support from incidental use, and we did the bulk of the work through Sparx EA's Relationship Matrix, which is built for exactly this: capabilities on one axis, applications on the other, relationships created and reviewed cell by cell with the owning teams. For the long tail of routine mappings we round-tripped spreadsheets with application owners — export, annotate, import — using scripts against the automation interface, on the pattern we describe in our guide to the Sparx EA automation API.
Two findings fell out of the mapping before anyone ran a single analysis, as they usually do. Three separate applications turned out to provide primary support to the same level-two capability in different regions — a consolidation candidate that had been invisible while the portfolio was organised by department. And one capability scored as highly critical in the assessment workshops was supported, primarily and solely, by an application whose own lifecycle field said it was due for decommissioning. Neither fact was new to everyone; both were new to the people who could act on them.
Connecting the map to strategy
The organisation's strategy named five priorities — driven by network electrification, an ageing asset base and a tightening regulatory regime — and we modelled these as ArchiMate Goal elements, with the underlying pressures as Drivers whose influence relationships target the goals, and linked each goal to the capabilities that realise it. This is the layer of the model that turns a capability map from an inventory into an argument: it makes "why does this capability matter" a question the repository can answer.
Four capabilities emerged where high strategic criticality met poor current fitness, and these became the focus of the investment views. The mechanics in Sparx EA were straightforward: model searches over the assessment tagged values to shortlist the capabilities, and a diagram legend applying fill colour from the fitness attribute so that the heat was visible on the map itself rather than living in a separate spreadsheet. The legend mechanism works well for a single attribute; where we wanted views coloured by different attributes for different audiences, we maintained separate diagrams, because a legend belongs to a diagram and keeping several of them consistent is manual discipline rather than automation.
A capability heat map is a record of a judgement, not a sensor reading. Its scores were voted by a room on a Tuesday afternoon and they decay from that moment. If the assessment is not refreshed on a cadence, the colours quietly turn from information into decoration — and decisions get made on decoration.
The investment view the board actually used
For each of the four priority capabilities we built one investment view: the capability, its supporting applications coloured by lifecycle status, and the proposed changes — replacements, consolidations, retirements — drawn against them. One diagram per capability, deliberately small, readable by a non-architect in under a minute.
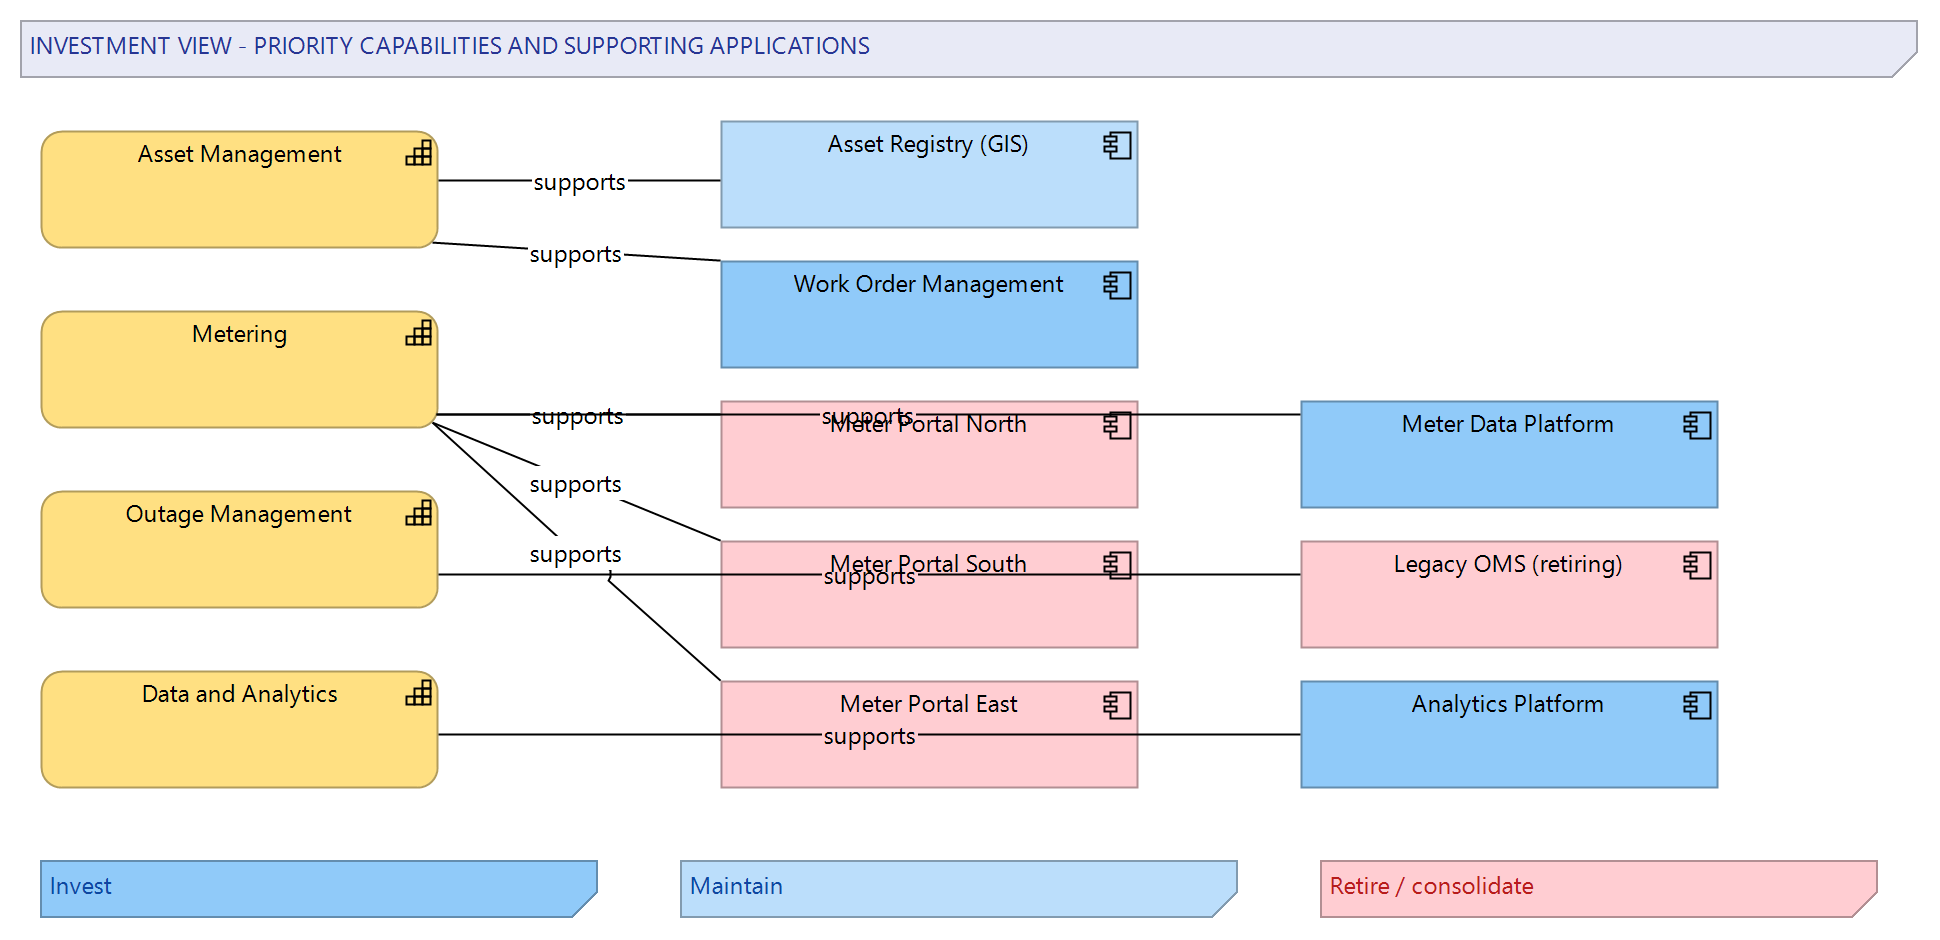
The board pack itself was generated from the repository using Sparx EA's document templates: the four views, the capability definitions, the assessment scores with the date they were voted, and the application list per capability with owners and lifecycle status. Generating rather than assembling mattered for a reason beyond effort — it meant every pack was rebuilt from the model as it stood that day rather than drifting quietly out of date, and when a director queried a detail, the answer came from the same source as the page in front of them.
The October portfolio board was the first run with the new material, and the difference was audible rather than dramatic. Discussions were shorter because the first twenty minutes of every item — establishing what the application was for — had been absorbed by the map. The consolidation candidate surfaced by the mapping was approved as a single funded initiative replacing two competing requests. The critical capability sitting on a retiring application, which had missed funding twice under its technical name, was funded once it was presented as a capability risk rather than a system upgrade.
What changed
The durable change was procedural rather than architectural. Investment requests above a modest threshold now name the capabilities they affect, using the map's vocabulary, and the portfolio board reviews the heat map quarterly with the scores' vote date printed on the page. Finance, initially the most sceptical party in the workshops, became the map's most reliable defender — capability language gave their cost allocations somewhere stable to live, which departmental structures had never provided.
For the architecture team, the map became the spine other work attaches to. New solution designs reference the capabilities they serve; the application inventory cleanup has held because every application now has at least one relationship that someone would miss; and when the next reorganisation arrived — eight months in, on schedule — the map absorbed it with renamed owners and not a single moved box, which did more for its credibility than any workshop had.
It is worth being honest about scale. This was around a hundred and ninety applications and under seventy level-two capabilities — a size at which the Relationship Matrix and manual assessment workshops are comfortable. Well beyond that, the assessment cadence itself starts to need tooling support, and the trade-offs change.
Keeping the map alive in the repository
A capability model that is going to carry investment decisions needs a little repository governance around it, and we put this in place before handover rather than leaving it as advice. The Strategy packages are writable by the two architects only, under Sparx EA's package-level security; business owners propose changes, they do not make them. This is not distrust — it is the recognition that a capability map's value is its stability, and a map that anyone can edit is a whiteboard with extra steps.
Before each assessment refresh, the architects take a baseline of the capability packages. Sparx EA's baseline facility keeps a snapshot inside the repository, and the comparison view answers the question that otherwise consumes the first half of every refresh meeting: what actually changed since last time? When a director remembers a capability scoring differently a year ago, the answer is a diff, not an argument. The baselines also gave the organisation something it had never had for the PowerPoint map — a defensible history of what was agreed and when.
Read access is the other half. The map is published to the wider organisation through the repository's HTML publication on the intranet, regenerated every quarter and after each assessment refresh, with the vote date on every page. The point is modest but real: anyone in the organisation who wants to know what "Meter Data Management" means, or which applications support it, reads the same answer the board reads, at most one quarter old. Before this, the honest answer to "which version of the capability map is current" had been "ask around".
What we deliberately did not do was automate the assessment itself. The temptation exists — pull incident volumes, cost figures and lifecycle dates into a computed fitness score, and the map updates itself. We advised against it here. The workshop vote is slower and cruder, but the moment the score is computed, the room stops feeling responsible for it, and the conversation the map exists to force stops happening. The half-day a month it costs to keep the judgement human was, in our view, the best-spent half-day in the whole arrangement.
What we would do differently
Two things. We would bring finance into the workshops from the first session rather than the third; their late arrival cost us a partial re-run of the level-one discussion, because cost allocation questions reopen naming questions. And we would set the refresh cadence — who re-scores the assessment, when, and with what quorum — in the very first session, when commitment is cheap, rather than at handover, when it competes with everything else on the practice lead's list. The map's owner now spends roughly half a day a month keeping it current, which is most of what the instrument costs to keep, and agreeing that half-day up front would have been easy. Agreeing it at the end took a month.
One limitation stands regardless: Sparx EA holds the map, the links and the scores, but it cannot hold the agreement. The repository records that "Outage Management" means what the room decided it means; the moment the people in that room stop meeting, the definitions start drifting apart again in conversation even while they sit unchanged in the model. The quarterly review exists as much to renew the agreement as to update the data.
Where they are now
Eighteen months on, the organisation has twice refreshed the full assessment without us in the room, which is the outcome we measure ourselves against. The map has grown a data dimension — information domains linked to the same capabilities — and the investment views have become the standard opening slide of every business case, generated from the repository each time. If you want a quick sense of how your own Sparx EA repository would hold up as the anchor for this kind of exercise, our free Sparx EA assessment is a reasonable place to start.
If your organisation is facing a similar gap between strategic priorities and application investment decisions — three lists that share no vocabulary, and a board asked to choose between them — you can reach us through our contact page.
This case study describes a representative engagement pattern. Organisational details are illustrative and do not identify a specific client.