The starting point
The organisation, a retailer, had grown the way retailers grow: organically for years, then suddenly, through two acquisitions in quick succession. Each acquisition arrived with its own systems, and three years on, nobody could say with confidence how many applications the combined company ran. The working estimate was around four hundred. The IT controlling team kept an inventory in a spreadsheet; the operations team kept a CMDB for the subset of systems they supported; the software asset management tool knew about licences. The three sources overlapped, disagreed, and none of them could answer the question the executive committee kept asking: where are we paying twice for the same thing, and what can we switch off?
The trigger for our involvement was a stalled rationalisation programme. A consultancy had delivered a slide deck naming savings targets, the targets had been accepted, and then the programme had spent six months failing to produce a defensible list of candidates — because every candidate list dissolved into an argument about the underlying facts. Which systems does this application feed? Who actually owns it? Is it really only used by the Belgian stores? The facts lived in heads and in three disagreeing sources, so every decision meeting turned into a research task.
Our brief was specific: put the application inventory into Sparx Enterprise Architect, connect it to capabilities, ownership and lifecycle, and make it good enough that a portfolio decision could be taken in a meeting rather than deferred from one.
Three inventories, no answers
Before building anything we compared the three sources properly, matching records by name, alias and hostname where we could. The exercise took a week of scripting and produced numbers that shaped everything afterwards. Only about half the applications appeared in all three sources. Around sixty appeared in exactly one. Names were the biggest obstacle: the same warehouse system appeared under its product name in the licence tool, an internal nickname in the spreadsheet, and a hostname-derived label in the CMDB. And each source had a different notion of what an application even was — the CMDB counted installed instances, the spreadsheet counted things people considered systems, the licence tool counted contracts.
The lesson we drew, and put in front of the steering group in week two, was that none of the three sources was wrong. They answered different questions, and each answered its own question reasonably well. The gap was that nobody had built the thing that connects them: a single list of applications as business-meaningful units, each carrying its identifiers in the other sources, each linked to what it supports and who answers for it. That connecting layer is an architecture model, whether or not anyone calls it that — and it is exactly what a modelling repository is for.
Starting from the questions, not the data
It is tempting to begin an exercise like this by importing everything and sorting it out later. We have seen where that leads: a repository that faithfully mirrors the confusion of its sources. Instead we ran two short workshops with the people who would consume the result — the CIO, the portfolio manager, two domain architects and the head of IT controlling — and asked what decisions the inventory had to support. The list came back concrete: find overlapping applications after the acquisitions, find applications without an owner, find applications approaching the end of vendor support while still carrying critical workloads, and show which capabilities are over-served and under-served.
Every one of those questions dictates model content. Overlap detection needs applications linked to capabilities at a level fine enough to distinguish, say, promotions management from pricing. Ownership questions need owners recorded against every application, and a way of noticing when the named person has left. Lifecycle risk needs status and dates on the applications themselves. Anything the questions did not need, we deliberately left out — no interface cataloguing, no data modelling, no process maps in the first phase. That restraint bought us speed, and speed bought credibility. The first useful answers came out of the repository about six weeks in, while the organisation still remembered why it had asked.
The model structure
The model itself is deliberately plain ArchiMate, held in a small set of packages with clear ownership. Applications are Application Components, one per business-meaningful application, regardless of how many installed instances the CMDB counts. Each carries a compact set of tagged values agreed in the workshops: lifecycle status from a fixed list, an owner and a deputy, criticality, hosting model, the identifiers used by the spreadsheet, the CMDB and the licence tool, and an annual cost band rather than a figure — bands were a deliberate choice, coarse enough to survive imperfect cost data, fine enough to rank.
Capabilities are ArchiMate Capability elements arranged as a three-level map, and applications connect to the capabilities they serve with serving relationships. Ownership went in twice over: a named owner in a tagged value, and a Business Role element linked to the organisational unit, so every application has both a person and a seat behind it. The double entry cost a little modelling effort and repaid it immediately: when a domain lead left the company that autumn, matching the leavers list against the owner tags listed every application whose ownership had just gone stale.
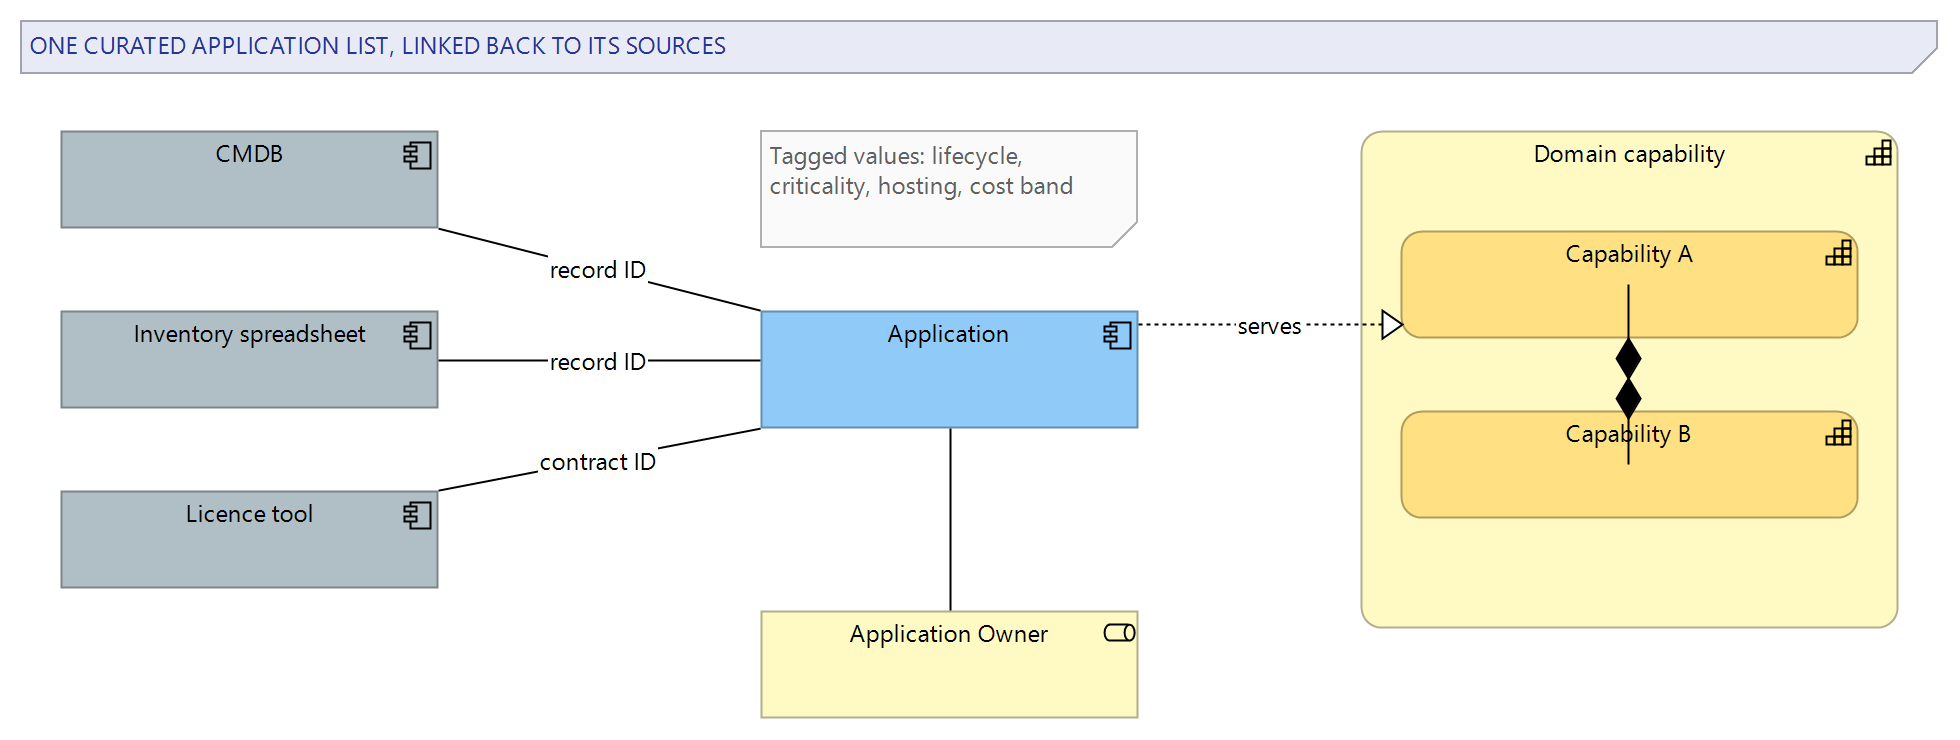
The structure in Figure 1 is small enough to explain in five minutes, and that was a design goal. Portfolio models fail socially before they fail technically: the moment a stakeholder feels the model is something only architects can read, they go back to asking for spreadsheets. Everything sits in a package structure with one owning team per package, and package-level security in the repository keeps edit rights aligned with that ownership.
The capability map underneath it all
The capability map deserved more care than any other part, because every interesting question routes through it. The client had two candidate maps — one inherited from the earlier consultancy, one sketched by the domain architects — and they disagreed in exactly the places the acquisitions had made messy. We ran three working sessions to merge them, testing every proposed capability against the same question: if two applications both serve this capability, is that redundancy worth investigating? Where the answer was no, the capability was too coarse and we split it; where two capabilities never produced a meaningfully different answer, we merged them.
The result was around a hundred and twenty capabilities at the third level, which is where applications attach. Store operations, e-commerce, supply chain, merchandising and the corporate functions each got a domain architect as steward. We resisted the recurring suggestion to model a fourth level: below a certain grain, capabilities stop being stable business abstractions and start being descriptions of current systems, and then the map ages as fast as the portfolio it is supposed to judge. Our approach to capability mapping is covered separately; the short version is that a map earns its keep by being argued about, and this one was argued into shape by the people who now defend it.
Loading and reconciling the data
With the structure agreed, loading was a scripting exercise over the automation API — the same toolbox we describe in our automation API guide. The import scripts read the three sources, applied a matching cascade — exact identifier match first, then normalised name match, then a fuzzy pass that only ever proposed, never decided — and wrote Application Components with their tagged values into a staging package. Anything the cascade could not settle went onto a review list, and we sat with the domain architects in four half-day sessions working through it, merging duplicates and christening applications that had lived their whole lives under three names.
The working setup was deliberately cautious. All imports ran first against an offline copy of the repository taken by project transfer, and only a rehearsed, reviewed run touched the shared model — a habit we keep from migration work, where the cost of a confident mistake is measured in other people's trust. Each import run wrote a log of what it created, matched and skipped, with counts per source, and we reconciled those counts against the sources before anyone looked at a diagram. The staging package was emptied only after the domain architects had signed off its contents into the main structure, so at every moment there was a clean answer to the question "what is in the model and why".
Two rules made the reconciliation tractable. First, the repository holds the master list of applications, but every element keeps the identifiers of its source records, so agreement or disagreement with the sources is checkable by script at any time, in both directions. Second, no attribute got imported without a nominated source of truth: cost bands come from controlling, support status from the CMDB, everything else from the architects. When sources conflicted, the rule decided which one won, and the losing value went into a discrepancy report instead of the model. The first discrepancy report ran to several pages and triggered some overdue housekeeping in the CMDB — a side effect the operations team, to their credit, treated as a gift.
Lifecycle, and the renewal question
Lifecycle information earned a subsection of its own in the design because it behaves differently from every other attribute: it is the one that goes stale silently and hurts loudest when it does. We modelled it as two things, not one. The status itself — planned, active, contained, retiring, retired — is a tagged value with a fixed list, and the workshops spent a surprisingly productive half-hour agreeing what contained means: still running, still supported, but closed to new consumers and new investment. That single agreed word now does work in every portfolio meeting, because "can we build on this?" has a one-glance answer.
The second half is dates. Applications going out of vendor support carry the date, and criticality sits next to it, so the renewal question — what important thing is running out of road? — is a stored search whose results arrive sorted by urgency. In the first run it surfaced a handful of genuinely uncomfortable rows: business-critical systems inside two years of end-of-support with no successor named anywhere. None of those rows was news to everyone, but every row was news to someone senior, and the search did what a spreadsheet buried in a shared drive had failed to do for years, which is make the uncomfortable rows unavoidable. Renewal planning is now a standing agenda item fed by that search rather than an annual archaeology project.
Making the repository answerable
A populated model still is not a decision tool; the questions had to become artefacts people could open. We built them with the standard machinery. Model searches answer the recurring questions directly: applications with no owner, applications past end-of-support with criticality above a threshold, applications whose lifecycle says retired but which still carry serving relationships. The Relationship Matrix, with applications on one axis and third-level capabilities on the other, became the overlap detector — every capability column with three or four marks in it is a conversation waiting to happen. For the executive audience we used the document templates to generate a portfolio pack: one page per domain, capabilities with their applications, owners, lifecycle and cost bands, regenerated from the repository on demand.
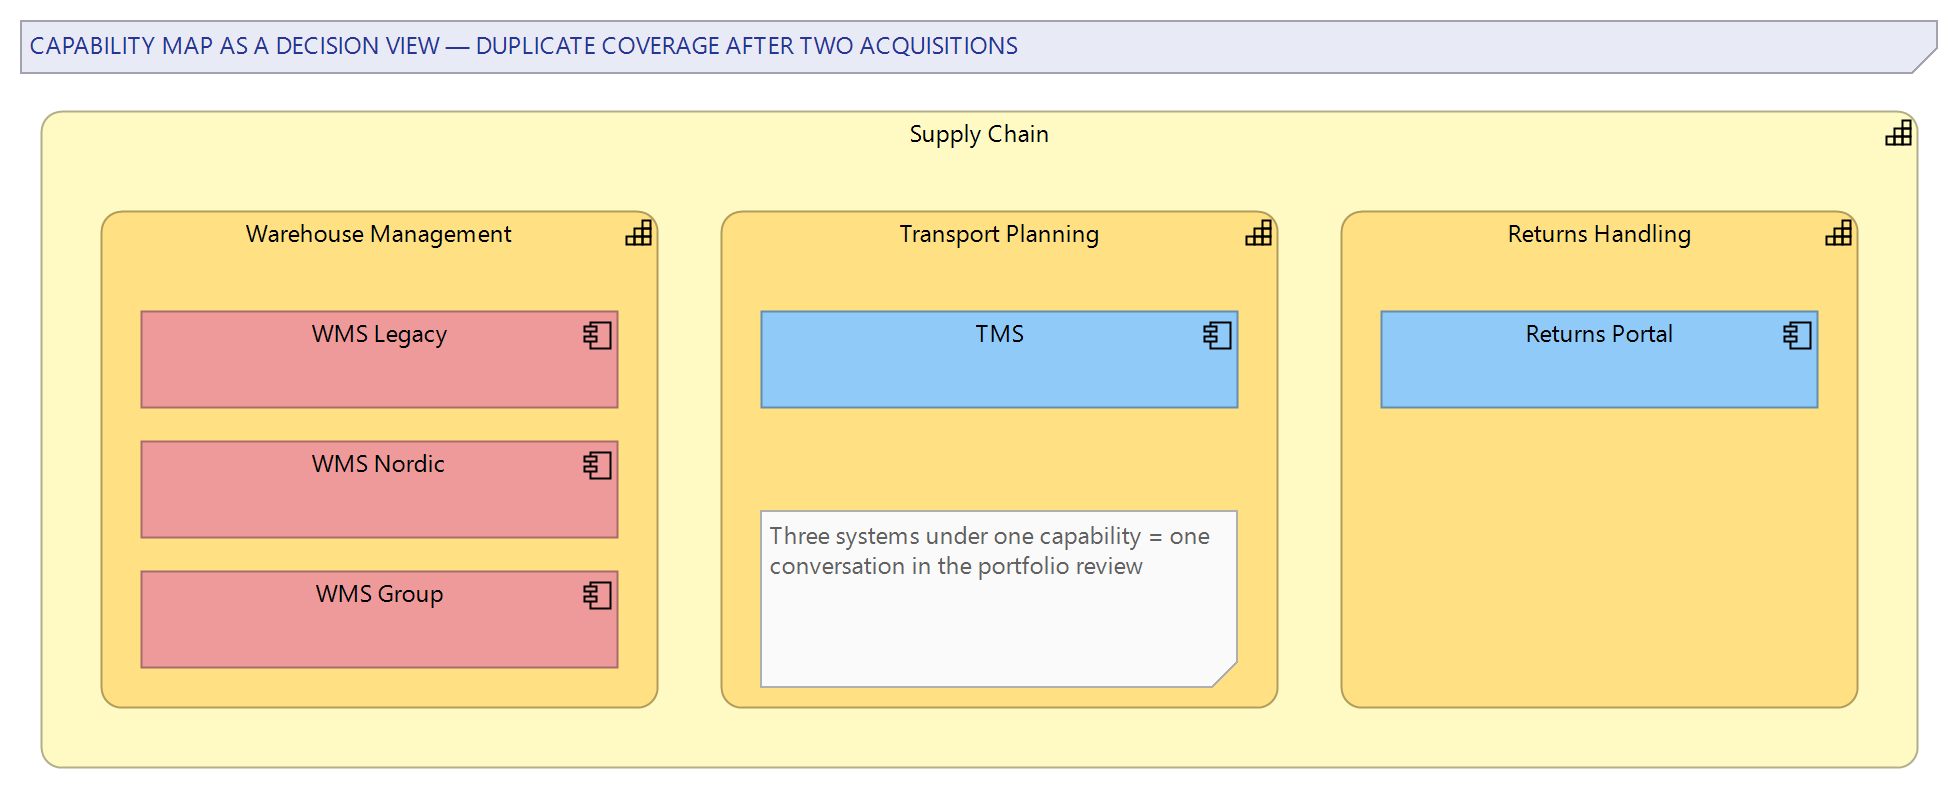
The view in Figure 2 became the emblem of the whole engagement: the capability map with applications overlaid, duplicates side by side under the capability they both serve. Three warehouse management systems under one capability needs no further explanation in a steering meeting. We generated these views by script rather than maintaining them by hand, so the nightly script run rebuilds them from the current relationships and nobody has to remember to update a picture.
The first portfolio review
The first portfolio review with the new material ran about two months into the engagement, and we deliberately kept its scope narrow: one domain, supply chain, where the overlap after the acquisitions was known to be worst. The preparation was the model itself plus a one-page brief per overlap cluster — the applications involved, their owners, cost bands, lifecycle, and the capabilities they share. The meeting did in ninety minutes what the stalled programme had not done in six months: it produced a shortlist of a dozen retirement and consolidation candidates, each with a named owner for the follow-up and, critically, underlying facts that held up under challenge. When someone questioned whether one of the warehouse systems really served the returns capability, the answer was to open the model, follow the relationship, and see which team had asserted it — and the discussion moved from whether the fact was true to what to do about it.
Not every candidate survived scrutiny, and that is worth saying honestly. Two of the twelve turned out to have contractual entanglements the model knew nothing about, and one duplication was deliberate, a regulatory separation between the grocery and pharmacy lines that the capability map had not distinguished. The model got a small correction out of that meeting — a capability split — which is exactly how it should work: the decision tool and the decisions improve each other.
After each review we took a baseline of the portfolio packages, so the state of the estate as it was judged that quarter is preserved and comparable. When someone asks, a year later, why a system was marked for containment, the baseline plus the recorded decision answers it without anyone reconstructing history from mail threads. It is a small discipline with an outsized payoff the first time an acquisition-era decision gets questioned by someone who was not in the room.
Keeping it current
An inventory that was accurate in spring and untouched since is worse than no inventory, because it is trusted and wrong. We left three mechanisms behind against that fate. A monthly reconciliation script re-reads the three sources and produces a delta report: new records with no counterpart in the model, model elements whose source records vanished, attribute drift on the ones that match. The portfolio manager works the deltas — most months this is under an hour. Quarterly, each domain architect reviews their own package against a generated checklist. And any project that introduces or retires an application now has a model update as an explicit step in its closure checklist, which took sponsorship from the CIO to make stick and did stick once two project closures were bounced for skipping it.
We also wired freshness into the outputs themselves: every generated document carries the generation date and the date of the last reconciliation run on its title page. Consumers learned to glance at those two dates the way they glance at a best-before date, and that small habit does more for honesty than any governance slide.
What changed for the client
The rationalisation programme restarted, this time with a factual floor under it. In the first year the organisation retired or consolidated a meaningful slice of the estate — the exact count moved as decisions did, but the direction was unambiguous, and for the first time each retirement traced to a recorded decision with the affected capabilities and owners attached. The quarterly portfolio reviews now run on regenerated packs rather than freshly assembled slides, which means the meetings argue about choices instead of about data. Application owners exist for the whole estate, and the monthly delta report keeps the claim honest.
The quieter change is linguistic. Capabilities became the shared vocabulary between business and IT for talking about investment — proposals now arrive saying which capability they strengthen, because that is how the portfolio is displayed and judged. The capability map that started as a modelling artefact turned into the table of contents for IT spending conversations. None of this required anyone outside the architecture team to open Sparx EA; they meet the repository as documents, matrices and views, generated from content they have learned to trust. If you want a sense of how mature your own setup is on that front, our Sparx EA assessment takes a few minutes and gives you a structured read.
Cost deserves a word, because it is where exercises like this usually overreach. We never tried to make the model a financial system. Cost bands, sourced from controlling and refreshed at budget time, turned out to be exactly the right resolution for portfolio work: precise enough to show that one of three overlapping systems sits two bands above either of its rivals, coarse enough that nobody could waste a meeting disputing decimals. When a consolidation case needed real figures, the model pointed to the controlling records through the stored identifiers, and finance produced the numbers from the system that actually owns them. The model's job is to know where everything is and how it hangs together — not to duplicate the ledgers.
Limits and lessons
The honest limitations first. Sparx EA is not a CMDB and should not be asked to be one: it holds the curated, business-meaningful layer, and it depends on the operational sources staying reasonably healthy underneath. Our reconciliation scripts detect drift; they do not repair the sources. Charting is the other limit — EA's built-in charts and dashboards are serviceable for architects but not something we would put in front of an executive committee, so the presentation layer is generated documents and exported views rather than live dashboards, and anyone expecting portfolio-management-suite visuals from the modelling tool alone will be disappointed. That trade-off — modelling depth over dashboard polish — was the right one here, but it is a real trade-off.
A portfolio model is a decision tool only while someone can say, in one sentence, where every number in it comes from. The moment provenance blurs, meetings go back to arguing about facts — and the spreadsheet era returns wearing a modelling tool's clothes.
What we would do differently is mostly a matter of order. We built the monthly reconciliation in the final third of the engagement; it belongs in the first third, because the sources started drifting from the model the day after each import, and we spent avoidable effort on one-off fixes before the standing mechanism existed. We would also budget more time than feels reasonable for the naming sessions — deciding what things are called sounds trivial and consumed four half-days of senior people, and every one of those hours was necessary. The technical work of an engagement like this is genuinely the smaller half; the larger half is manufacturing agreement, and the model is where the agreement is stored.
If your application inventory lives in spreadsheets that disagree with each other and portfolio decisions keep dissolving into research tasks, this is a well-trodden path out — you can reach us through our contact page.
This case study describes a representative engagement pattern. Organisational details are illustrative and do not identify a specific client.