An integration map that lived in people's heads
The organisation was an e-commerce retailer that had grown quickly and organised itself the modern way: some twenty product teams, each owning a slice of the platform, each exposing its capabilities to the others as APIs. Well over a hundred internal APIs existed by the time we arrived, fronted — mostly — by an API gateway, described — partly — by OpenAPI specifications of varying vintage, and understood — entirely — by nobody. The standing method for answering an integration question was to ask in the engineering chat and hope the right person was not on holiday.
The engagement had a precipitating incident, as these engagements usually do. A team had changed the behaviour of what it believed was an internal stock-checking endpoint, on the reasonable grounds that its only consumer was its own front end. It had four other consumers, one of which was checkout, and the discovery was made by the checkout conversion dashboard during a promotion. The post-incident review's first action item was not better testing; it was the question that testing depends on — how do we know, for any API, who consumes it? Nobody could answer it, and the platform director asked us to make it answerable.
The request, precisely put: a maintained map of the API landscape — services, providers, consumers, exchanged data — in the organisation's Sparx EA repository, seeded and kept current by automation rather than by heroics, and able to answer impact questions in minutes.
Three generations of integration at once
Discovery showed the landscape was really three landscapes deposited in layers, like geology. The newest layer was the gateway: REST APIs, registered, authenticated, logged. Beneath it lay a middle period of direct service-to-service calls that predated the gateway and had never been migrated behind it — reachable, undocumented, invisible to gateway logs. And at the bottom, the original monolith era survived as direct database links: three consuming systems reading tables that belonged to others, a fact that two of the three owning teams had forgotten.
The gateway's own registry, the obvious foundation, turned out to be accurate but partial. It knew every API it fronted — around ninety at the time — with their versions and authentication modes, but it knew nothing of the two older layers, and its ownership records had decayed as teams had split and merged. The OpenAPI specifications, where they existed, described request shapes faithfully and consumers not at all, because specifications describe what an API offers, never who depends on it. Every source told part of the story; the repository's job was to be the place the parts became one story.
The final tally, once the mapping settled: around ninety gateway-fronted APIs, a few dozen pre-gateway direct integrations, three surviving database links, and roughly forty event topics that carried meaningful business traffic. Nobody in the organisation had guessed the middle number within a factor of two, in either direction — some had assumed the gateway migration was essentially finished, others that the old layer still dominated. Both camps had been arguing platform strategy from their assumption for a year. Replacing the assumption with a count did not settle the strategy, but it did settle which strategy discussion was worth having, which is frequently the larger service a model performs.
A vocabulary for services, interfaces and consumers
We kept the metamodel small and ArchiMate-native. Each API is an application service, realised by the application component that provides it — team ownership rides on the component, since teams own systems and systems expose APIs. Consumers connect by serving relationships from the service to the consuming component. Exchanged business data appears as data objects, linked by access relationships, so "who touches order data" is a model query rather than a meeting. The service element carries the operational facts as tagged values: gateway identifier, version, protocol, lifecycle state, authentication mode, and the owning team as a stable name matched to the component's owner.
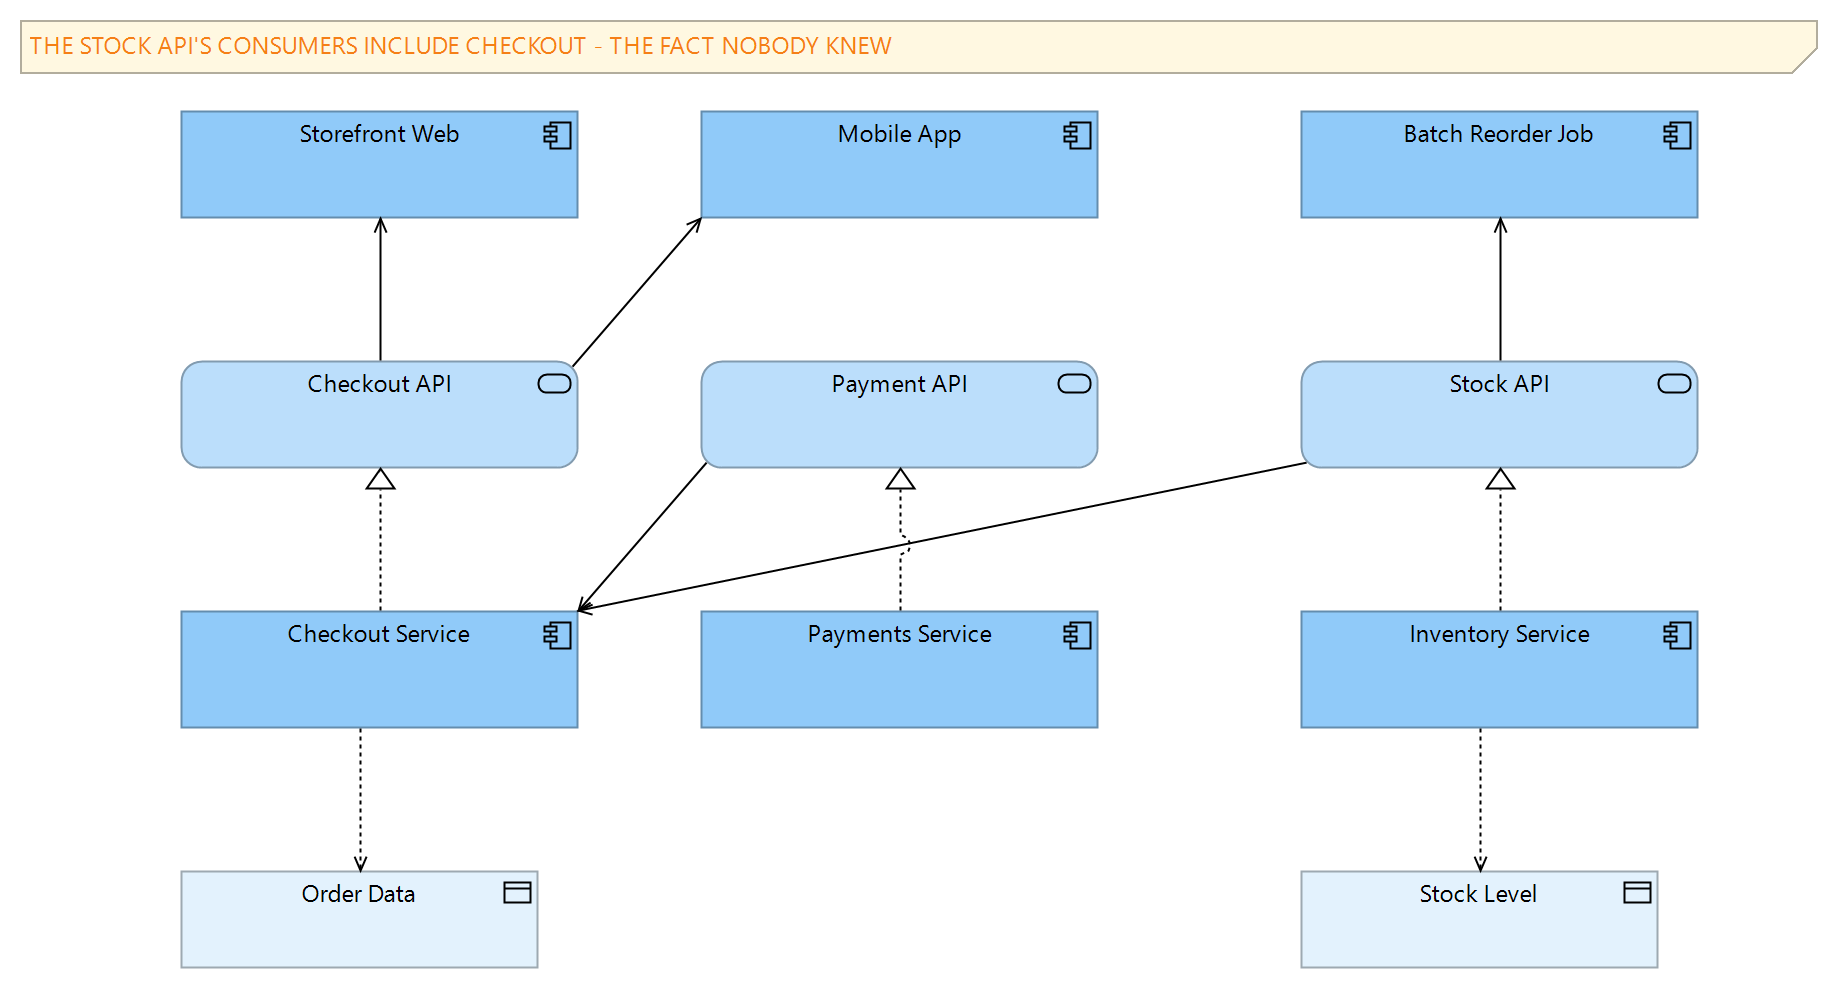
Two modelling decisions earned their keep repeatedly. First, the API is the service, not the interface: we reserved application interfaces for the handful of cases where one service is exposed through genuinely distinct access points with different contracts, rather than scattering interface elements everywhere for ceremony. Second, the legacy layers got no special vocabulary — a direct database read is an access relationship from the consuming component straight to the data object, flagged with a mechanism tagged value, so the awkward integrations sit on the same map as the blessed ones. A map that only shows the architecture you are proud of is a decoration, and it is exactly the kind of undocumented consumer those layers breed that had caused the incident.
Seeding the model from the gateway, not from meetings
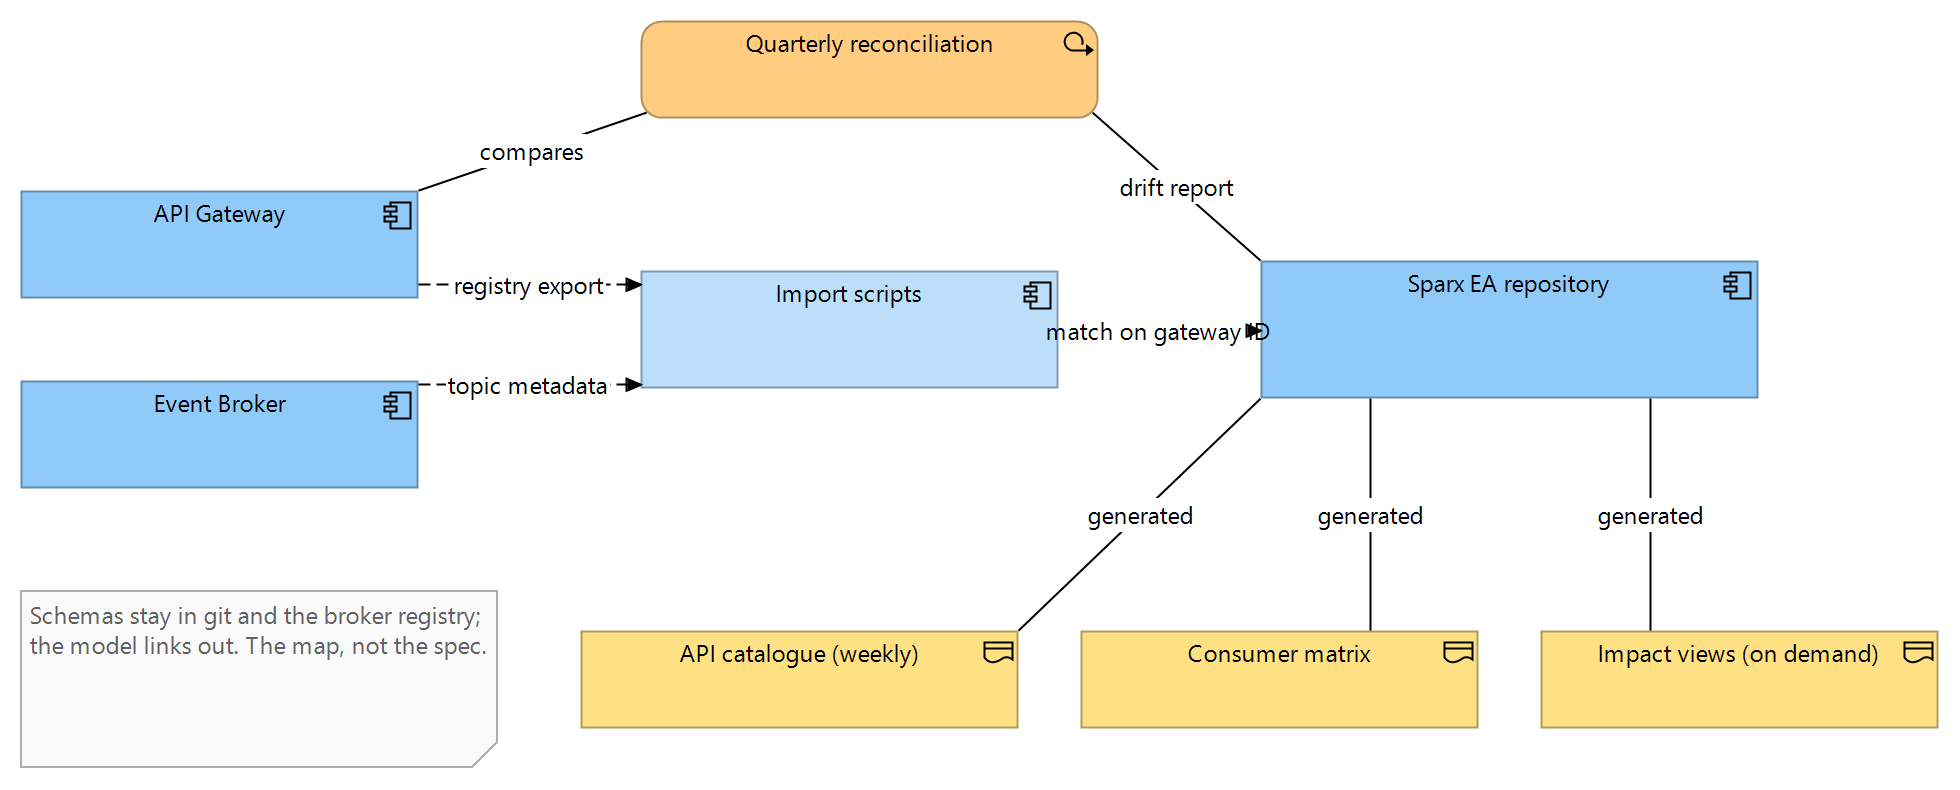
Nothing kills an inventory like asking twenty teams to fill in a spreadsheet, so the first population of the model came from machines. A script over the Sparx EA automation API reads the gateway's registry export, matches on the gateway identifier tagged value, and creates or updates the service elements: version, protocol, authentication, lifecycle. The same run parses the OpenAPI specification index to link services to their documentation. First execution created the ninety-odd gateway-fronted services in a morning, correctly named and attributed, which bought the engagement more credibility with the engineering teams than any workshop could have — the model arrived already knowing things.
What machines could not know, humans supplied in short order: a matching workshop per domain to attach each service to its providing component, confirm team ownership, and add the services from the pre-gateway layers that no export would ever surface. These sessions were quick precisely because they started from a populated model — engineers correct a nearly-right list far more willingly than they populate an empty one. The full first pass, gateway seed plus five workshops, took under a month alongside everyone's day jobs.
Finding the consumers
Providers are the easy half; the incident had been about consumers. For gateway-fronted APIs, the gateway's access logs held the answer: a month of logs, aggregated by API key, mapped keys to consuming applications and thereby to serving relationships in the model. The mapping was not perfectly clean — shared keys existed, as they always do, and each shared key became a small piece of remediation work with a deadline — but within six weeks every gateway API had its consumer list drawn from observed traffic rather than from anyone's memory.
The older layers needed archaeology. Direct service calls were traced through configuration files and service discovery records; the database links came out of grants and connection audits with the data platform team. We recorded the confidence honestly: every serving relationship carries a source tagged value — observed from logs, declared by team, inferred from configuration — so a reader knows whether a link is evidence or testimony. The distinction sounds fussy and is not: when the deprecation programme later leaned on the model, "no observed consumers for ninety days" and "no consumers anyone remembers" justified very different levels of courage.
Every dependency in the model says how it knows: observed, declared or inferred. The tag costs seconds at entry time and settles arguments for years.
Event streams belong on the same map
A third of the platform's integration ran over its event backbone rather than request-response APIs, and the temptation was to call that a separate problem. We resisted, because impact analysis does not care about integration style: the checkout team needs to know who reacts to an order event with exactly the urgency it needs to know who calls the stock API. Each significant topic became an application service of a declared event kind, with flow relationships carrying the event from publisher to subscribers, seeded from the broker's own metadata — consumer group registrations, mapped to owning applications through the broker's naming convention, make subscribers far more enumerable than REST consumers ever are — though we never treated the list as exhaustive.
One map with both styles on it changed several conversations. Teams discovered that retiring a REST API they disliked would be undone by the event stream shadowing it; the platform team could finally see which topics had become load-bearing infrastructure with single-team governance; and the architecture group got its first true picture of coupling, which was — as suspected but never demonstrable — heavier through events than through the APIs everyone argued about.
The catalogue, the matrix and the impact views
A model nobody reads maintains itself briefly and then not at all, so the outputs got as much design as the metamodel. Three mattered. The API catalogue: a generated document, one page per service — description, owner, version, lifecycle, consumers, links to specification and documentation — produced from the repository through EA's document templates and published on the engineering portal weekly. The consumer matrix: the Relationship Matrix scoped to services against consuming components, per domain, which became the standing artefact in change discussions. And the impact views: a script generates, for any chosen service, a diagram of the service's immediate neighbourhood — its provider, its consumers, the services those consumers themselves provide onward, and the data it touches — laid out and dated, on demand in about a minute.
The impact views deserve a sentence on why they are generated rather than drawn. A hand-drawn impact diagram is an opinion about what matters, frozen at drawing time; a generated one is a query result, and its authority comes from everyone knowing no hand curated it. When the checkout team now assesses a change, the first artefact in the ticket is the generated view, and the review discussion starts from the same picture for everyone — which was, nearly word for word, the action item the incident review had asked for.
The repository around the map
The model lives in the organisation's Sparx EA repository on Pro Cloud Server, in a structure that keeps machine-written and human-written content apart, because they change at different speeds and break in different ways. The service elements the import scripts own sit in packages per domain under a services branch; the components, data objects and diagrams the humans own sit beside them; and a conventions package holds the tagged value definitions, the value lists and a one-page modelling guide. The import scripts refuse to write outside their branch — a cheap safeguard that has prevented every category of accident it was designed for.
Editing rights follow the same seam. The scripts run under their own identity, with EA's user security locking the machine branch to that identity's group; each domain's architect curates the human branch for their domain; and everything is readable by every engineer through the standard client or exports. A baseline is captured quarterly, aligned with the reconciliation cycle, so the map as it stood at any quarter can be reproduced — which turned out to matter to the audit function for change evidence, an audience nobody had in mind when the arrangement was designed.
A small library of model searches rounds out the furniture: services in a deprecated lifecycle state with observed consumers still attached, services with no description, components with no owner, data objects accessed by more than five consumers. The searches run on demand and feed the weekly catalogue's health page, and they encode the questions the platform team decided it never wanted to be surprised by again.
Keeping the map true
Seeding a model is a project; keeping it true is a process, and we built the process on two legs. The first is the definition of done for platform changes: a new API, a version change or a retirement is not release-complete until the model reflects it, checked not by ceremony but by tooling — the release pipeline calls a small validation that the gateway identifier in the release exists in the repository with matching version and owner. Teams grumbled for a sprint and then stopped noticing, which is the trajectory of every good check.
The second leg assumes the first will leak, because every process leaks. A quarterly reconciliation script compares the gateway registry and broker metadata against the model and reports drift in both directions: APIs that exist in production but not in the map, and map entries whose production counterpart has gone. The first reconciliation found a dozen discrepancies; the most recent found two. The report goes to team leads, not to a central authority, because the owner of a drift is the team whose API drifted — the centre's job is to make drift visible, not to chase it. This division of labour is the difference between a repository the organisation maintains and one that decays the day the consultants leave.
A worked example: retiring stock API v1
The arrangement is best shown working, so here is one retirement as it actually ran, late in the engagement — the descendant of the API from the original incident, pleasingly enough. The stock team wanted to retire version one of their API, six months after version two had shipped. Step one was a generated impact view: eleven consumers still on v1, each named, each with its evidence grade. Eight were declared migrations-in-progress; two were services whose owning teams did not know they were still calling v1 — pinned client libraries, the usual story; one was a shared key remnant that log analysis resolved to a batch job.
Step two was coordination off the matrix rather than in a meeting: the stock team opened one ticket per consumer, quoting the model's evidence, with a sunset date three months out. The map's lifecycle field moved to deprecated the same day, which put v1 onto the weekly health page — with its log analysis promoted to a weekly run for the duration — and kept it there, politely and publicly, until the consumer count reached zero. Two consumers missed the first date; the observed-traffic evidence made the follow-up conversation short and unheated, because nobody was arguing about facts.
Step three, at zero observed calls across a full quarter: the gateway route was removed and the lifecycle field moved to retired the same day; the reconciliation that quarter — which treats an intentionally retired entry as a match, not as drift — reported clean. Total elapsed time, a little over seven months, and almost none of it spent in meetings. Under the pre-map regime this retirement had been discussed for two years and attempted never. The point is not that a model makes retirement automatic — it is that every step ran on shared, inspectable facts, and the facts were nobody's opinion.
What we kept out of the model
The named limitation, stated plainly: the repository does not hold API payload schemas, and it never will. The schemas live where they are already governed — OpenAPI files in the teams' repositories, subject schemas in the broker's registry — and the model links out to them through hyperlink tagged values. We took this position early against some enthusiasm for a single tool that holds everything, and we would take it again. Schema detail changes at code speed; an architecture repository that tries to track code speed loses, and its staleness then poisons trust in the parts that were right. Sparx EA is the map of the landscape: which services exist, who provides them, who depends on them, what data they move. The contract detail stays in the tools that already govern it, and the map points at it rather than copying it.
The same principle bounded runtime ambitions. The model knows consumers from log analysis quarterly; it is not an observability platform and does not compete with tracing tools that answer "what called what, yesterday, at what latency". Architecture repositories earn contempt when they promise operational freshness they cannot keep; ours promised a truthful quarterly map and a weekly catalogue, and kept both.
What changed
The deprecation programme is the cleanest result to point at. Armed with consumer lists graded by evidence, the platform team retired a dozen APIs that had no observed consumers across two reconciliation cycles and whose owners confirmed no out-of-band use — retirements that had been proposed for two years and never executed, because nobody could prove the absence of dependents. Two further candidates were saved from retirement when the map showed inferred consumers that log analysis then confirmed; both would have been the next incident.
Change assessment moved from chat archaeology to a generated view, as described, and the difference shows up where the organisation feels it: change lead time on shared APIs came down noticeably, and the integration questions in the engineering chat changed character — from "does anyone know who uses this" to "the map says these four, anyone missing?", which is the correct residual role for collective memory. New engineers get the catalogue and the domain matrices in their first week, and the map has become how the platform explains itself to its own builders.
At the time of writing, the model covers the gateway layer completely, the event backbone's significant topics, and the legacy layers to the depth the archaeology reached — we would not certify the last of these as exhaustive. The quarterly reconciliation only covers what the gateway and broker can see, so the legacy layers are re-checked by a yearly repeat of the archaeology — grants, configuration files, discovery records — rather than by the script.
What we would do differently
We would grade dependency evidence from the first day rather than retrofitting the source tags in month two; the retrofit cost a tedious week that a day-one convention would have avoided. We would also start the shared-API-key cleanup immediately upon finding shared keys, in parallel with the mapping, rather than treating it as someone's later problem — two of the keys were still shared when the first impact analyses ran, and blurred exactly the consumer lists that mattered most.
And we would be firmer, earlier, about the catalogue's editorial standard. The first generated catalogue faithfully exposed every description field the teams had written, and a third of them were empty or said "TODO". Machines generating documents from a model amplify whatever the model contains, including its neglect. A single sprint of description-writing, prompted by a completeness report, fixed it — but the first impression of the catalogue was weaker than the model deserved, and first impressions of architecture artefacts are spent once. The report that would have prevented it took an hour to write and now runs weekly.
If your API landscape is described by a gateway that knows half the story and a chat channel that knows the rest, the map is buildable faster than you would guess, and mostly by scripts — you can reach us through our contact page.
This case study describes a representative engagement pattern. Organisational details are illustrative and do not identify a specific client.