Three shapes of question
Architecture repositories get consumed through three fundamentally different lenses, and most published portals only do the first one well.
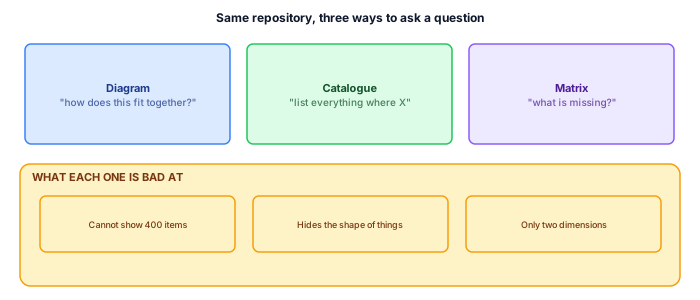
A diagram answers a question about structure: how these eight things relate. A catalogue answers a question about a population: list everything that matches this condition. A matrix answers a question about coverage: where does the expected relationship not exist.
Why diagrams get over-used
Diagrams are what modelling tools are for, so they are what architects produce. They are also what stakeholders ask for, because a picture is what they have seen before.
The failure is silent. Asked "which applications hold personal data", an architect produces a diagram with forty boxes on it. It is technically an answer. It is unusable: it cannot be sorted, cannot be filtered, cannot be pasted into a spreadsheet, and if the answer is really four hundred applications it cannot exist at all.
The reader wanted a list. They asked for a diagram because that is the artefact they knew to ask for.
Designing a catalogue people use
A catalogue is a table over a population of elements, with columns drawn from tagged values. Three decisions determine whether it gets used:
Scope it to a population, not a type
"All Application Components" is a type dump. "Applications holding customer data" is a population someone was actually asking about. The second requires that your metadata supports the filter, which is usually the real work.
Six columns, not sixteen
Every column costs horizontal space and attention. Name, owner, lifecycle, criticality, one domain-specific column and a review date is usually enough. If someone needs the seventeenth attribute they can open the element.
Make it sortable and filterable in the browser
A static table of four hundred rows is a scrolling exercise. The same table with client-side sort and a text filter is a tool. This is cheap to implement and it is the difference between a page people bookmark and a page they visit once.
Matrices show absence
A matrix puts one set of elements on each axis and marks where a relationship exists. The value is almost entirely in the empty cells.
Requirements against verification cases: the blanks are untested requirements. Controls against regulatory obligations: the blanks are unaddressed obligations. Capabilities against applications: the blanks are capabilities nothing supports.
A populated matrix is reassuring and mostly uninformative. A matrix with a visible hole in the top-right quadrant starts a conversation that would not otherwise have happened. Design them so absence is the thing the eye lands on.
Where matrices break
They are two-dimensional, and that is a hard limit. A matrix of applications against data entities is readable at 40 × 30. At 400 × 300 it is a texture, not a communication.
The usual fix is to matrix at a level of abstraction where the axes are small — capabilities rather than applications, obligation groups rather than individual clauses — and let the reader drill into a catalogue for the detail. A matrix that needs scrolling in both directions has already failed at its one job.
A reasonable starting set
For most enterprise repositories, four artefacts cover the questions that actually arrive:
- An application catalogue with owner, lifecycle and criticality.
- A data catalogue with classification and owning system.
- A requirement-to-verification matrix, because the gaps are audit findings waiting to happen.
- A capability-to-application matrix, because it exposes both duplication and absence in one picture.
Publish those four before building a fifth diagram. They will get more use than anything else in the portal, and they are considerably cheaper to maintain because they are generated rather than drawn.
Generating catalogues rather than drawing them
The reason catalogues are cheaper to maintain than diagrams is worth making explicit, because it is the strongest argument for building them.
A diagram is drawn. Someone decided what to include, positioned it, and will have to revisit that decision every time the model changes. A catalogue is a query. Add an application to the repository and it appears in the catalogue at the next publication, with no one doing anything.
This changes the economics of coverage. Maintaining forty diagrams is a standing commitment. Maintaining forty catalogues is maintaining forty queries, which mostly do not change.
The matrix that finds real problems
If you build only one matrix, build requirements against verification.
It is the one that reliably surfaces something actionable, because the empty cells are not modelling gaps — they are requirements nobody has established are met. In a regulated environment that is an audit finding waiting to be discovered by someone else, and finding it yourself is considerably cheaper.
Second choice: controls against obligations. Same structure, same property — the blanks are the interesting part, and they are the kind of blank that has consequences.
The columns that decide whether a catalogue is used
Catalogue design fails in one direction: too many columns. Every stakeholder asks for one more, none of them objects to anyone else's, and the result is a forty-column table that has to scroll sideways and answers nothing at a glance.
The discipline that works is to make each column earn its place by naming who filters or sorts on it. A column nobody filters by is reference data and belongs on the element's own page, not in the table.
For an application catalogue that usually leaves six: name, owner, business capability, lifecycle status, criticality, and hosting location. Every one of those is something a real person filters by, and together they answer most of what procurement, risk and delivery arrive asking.
The test to apply before adding a seventh: if this column were empty for every row, would anyone notice within a month? For most proposed columns the honest answer is no, and that is also a prediction about whether it will ever be populated.
Empty cells are the output
The first generated catalogue is embarrassing. Half the owner column is blank, lifecycle is populated for a third of the estate, and criticality exists only where someone did a risk assessment. The instinct is to delay publication until it is filled in.
That instinct is wrong, and resisting it is the single most useful thing a portal does in its first quarter. The blanks are the finding. A published table with two hundred missing owners is a work list that creates its own pressure, because it is visible to the people who care about ownership. The same information in an unpublished spreadsheet creates none.
What makes this survivable is framing. Publish it with the completion percentage stated at the top and a note saying what is being done about it. A table that admits it is 38% complete reads as progress; the same table presented as authoritative reads as incompetence, and the difference is one sentence.
Matrices at the wrong scale
A matrix works when both axes are countable at a glance. Twenty by twenty is a matrix. Two hundred applications by fifty capabilities is a wall, and a wall communicates less than no matrix at all because it implies completeness while being unreadable.
Three ways to bring one back to a usable size, in order of how often they are the right answer:
- Scope one axis. One domain's applications against all capabilities. Six readable matrices beat one unreadable one, and each has an owner who cares about it.
- Aggregate one axis. Capability groups rather than capabilities. Loses detail, gains the ability to spot a gap from across the room, which is what a matrix is for.
- Invert it into a list. If what you want is the capabilities with no application, that is a list of eleven things, not a grid of ten thousand cells. Reach for this more often than feels natural.
Keeping generated tables trustworthy
A generated catalogue is trusted or ignored, and the thing that decides it is not accuracy — it is whether a reader can tell how old the data is and where it came from. A table with no provenance gets treated as decoration the first time someone spots a stale row.
Three things to put on every generated table, none of which costs anything at generation time:
- The extraction timestamp, in the header, in plain language. "As of 12 March" rather than a build number.
- The scope, stated as a sentence. Which packages this covers and therefore what its absence from the table does and does not mean.
- A link from every row back to the element it came from, so a reader who doubts a value can see the source rather than emailing about it.
The third one also changes behaviour on the modelling side. Once a wrong value in a table is one click from the element that holds it, corrections start arriving from readers instead of being noticed by architects, and that is the point at which a published catalogue starts improving the model rather than only reporting it.
Who owns a catalogue
A generated catalogue looks ownerless because nobody typed it, and that is exactly why it decays. Somebody has to be accountable for the columns being populated, and it cannot be the person who wrote the generator.
The ownership that works is per column, not per table. Lifecycle status belongs to whoever runs the application portfolio. Criticality belongs to risk. Business capability belongs to the architecture team. Owner belongs to whoever runs the service catalogue, if one exists, and to nobody in particular if it does not — which is why that column is always the emptiest.
Naming those owners in the portal, next to the completion percentage, does more for data quality than any amount of chasing. A blank column with a named owner is a visible commitment; a blank column with no owner is scenery.
Exporting to a spreadsheet, and why to allow it
Every published catalogue eventually gets copied into Excel by someone who needs to pivot it, annotate it, or send it to a person without portal access. Architecture teams tend to resist this, because a spreadsheet is a copy that immediately starts drifting.
Resisting it does not stop it — it produces a worse copy, made by selecting the HTML table and pasting, with the formatting mangled and no record of when it was taken. Providing a download button costs nothing and lets you control what goes in it.
What to put in the export that the on-screen table does not have: the extraction date in a cell rather than a header, the scope statement, and a stable link back to each element. Then a spreadsheet found in someone's inbox nine months later can be dated and traced, which is the difference between a stale copy and a misleading one.
The matrices worth building first
A portal can generate any matrix, and generating all of them produces a menu nobody reads. Three earn their place in almost every estate, and each earns it by exposing a specific kind of absence.
Capability to application. The gaps are capabilities nothing supports, and the clusters are capabilities six things support. Both are budget conversations, and this is the matrix most likely to be shown to someone outside IT.
Application to data object. The gaps are data with no system of record, which is the question that arrives from every data governance programme and is usually answered with a guess.
Application to hosting location. Dull until a regulatory question about data residency arrives, at which point it is the only artefact anyone wants and the only one that can be produced in an afternoon rather than a fortnight.
Everything else can wait for someone to ask for it. A matrix generated because a stakeholder asked has a reader; a matrix generated because it was possible has none.
From catalogue to conversation
The highest use of a good catalogue is not lookup; it is agenda. A table with the right columns, current as of Monday, turns three recurring meetings from opinion exchanges into working sessions, and this is where the investment stops being about publishing and starts being about how the practice governs.
The application review stops opening with a slide and opens with the catalogue filtered to the domain at hand: here are the fourteen applications, their owners, lifecycles and review dates — which rows are wrong? Wrong rows are the meeting's product, and each one is either a model fix or a real-world action with a name attached. The risk conversation runs off the matrix rather than around it: the empty cells in controls-by-platform are the agenda, in priority order, with nobody able to claim the gap was unknown. And the quarterly portfolio session works down the catalogue sorted by review date, oldest first — a mechanism that quietly guarantees every element gets human eyes on a cadence, without anyone maintaining a separate tracking sheet that drifts from the model within a month.
The prerequisite is trust in the table, which is why every discipline earlier in this article — generated not drawn, gaps shown honestly, provenance visible — feeds this section. A catalogue that was wrong once in a meeting is dead as an agenda for a year. One that has been reliably right becomes something better than a publication: it becomes the shared surface on which the practice and its stakeholders agree about reality, which is as close to a definition of working governance as architecture gets.
None of this diminishes diagrams — they remain the right tool for structure, flow and the shape of things. But a practice that publishes only diagrams has chosen to answer only one of the three shapes of question its readers bring. The tables are where the other two live, they cost a fraction of the diagram effort to generate, and they are — quietly, reliably, in every estate we have measured — the pages the readers actually use most. Publish accordingly.
Start, if starting from nothing, with a single table this week: applications, owners, lifecycles. Twenty rows of it will be quoted in a meeting within the month, and the demand it creates will fund every table after it — which is how catalogue programmes actually begin, one useful list at a time.