The question that had no owner
A logistics service provider — warehousing, road transport, customs handling, a few thousand employees across several countries — asked us a question that sounds elementary and almost never is: if we change this system, what breaks?
The occasion was an approaching ERP replacement, but the question was older than the programme. The company ran on messages: orders arriving by EDI from retail customers, shipment instructions flowing to warehouse and transport systems, customs declarations going to government platforms, status events streaming back to customer portals. Every one of those connections had been built by someone, at some point, for a reason. Almost none of them were documented anywhere a planner could find. Interface knowledge lived with two integration developers, a folder of mapping specifications last updated years earlier, and the middleware's runtime configuration — which was accurate, exhaustive, and readable by nobody outside the integration team.
The cost of the invisibility was familiar. Every change went through the same two developers, who had become a human impact-analysis service with a queue. Estimates for touching any core system carried a contingency that everyone privately understood to be a fear premium. And an incident the previous winter — a warehouse system update that silently stopped a customs feed for a day and a half — had ended with a post-mortem whose first recommendation read, in effect, "know what talks to what". The ERP programme turned that recommendation into a funded piece of work, and we were engaged to build the dependency map in Sparx EA and, more importantly, to make it answer questions faster than the two developers could.
Evidence first, interviews second
Dependency mapping engagements go wrong when they are built from interviews alone, because people describe the landscape they remember building, not the one that runs. We inverted the usual order: evidence first, people second.
The middleware was the richest seam. Its routing configuration enumerated every message path it carried — source endpoint, target endpoint, message type, transformation. We exported that configuration and a month of traffic logs, and turned them, with scripts, into a first-cut interface inventory: which system pairs actually exchanged which message types, at what rough volumes. The traffic data mattered as much as the configuration, because it separated the busy paths from the apparently dormant ones — dozens of configured routes with no traffic that month, each of which was confirmed with its owner, seasonal and quarterly runs included, before anyone called it dead. Around the middleware we gathered the untidier evidence: the EDI gateway's partner setup, firewall rules for the connections that bypassed the middleware entirely, database link definitions, and the scheduled file transfers that no diagram ever admits to.
Only then came the interviews — a dozen sessions with system owners and the integration developers, walking the evidence rather than a blank page. The conversations changed character completely with data on the table. Nobody was asked to remember their interfaces; they were asked to explain the ones we could prove, claim or disown the ambiguous ones, and name the handful the evidence could not see. That last category was real: two systems exchanged data through a shared folder that appeared in no configuration we had harvested, and one nightly feed ran from a database job on a server the infrastructure team had stopped tracking. Both went into the model flagged with their evidence source, a habit we kept for every flow in the repository: each one carries a tagged value recording how we know it exists.
The evidence tag earned its place within the quarter. When a flow's existence was later disputed in a workshop — the owning team was adamant their system had never fed the reporting platform — the model could answer "middleware route, four thousand messages last March" instead of "someone told us", and the dispute ended in a correction to the team's understanding rather than to the model. Provenance is what lets a model win arguments politely.
How we modelled interfaces and flows
In the repository we kept the metamodel deliberately narrow, because dependency maps die of ambition more often than of neglect. Application components for the systems — about eighty, once the definitional arguments were settled. Application services for the meaningful provided capabilities of the core systems. And for every live connection, a flow relationship carrying a named information object: not "data", but "transport order", "customs declaration", "stock snapshot", "delivery status event". Naming the payload was non-negotiable, and it did more analytical work than any other single decision; impact analysis, when it came, would be phrased almost entirely in terms of who consumes which information.
Each flow also carried a small, fixed set of tagged values: transport mechanism (EDI, API, file, database link, queue), frequency, direction, the evidence source mentioned above, and a criticality marker agreed with the business — essentially, does this flow stop trucks, stop invoices, or stop neither. We resisted modelling message formats, field mappings and protocol detail in Sparx EA; that depth belongs to the integration team's own tooling, and duplicating it would have created a second, staler copy. The repository answers structural questions; the mapping specifications answer implementation ones; each links to the other. Drawing that boundary early is one of the things we have learned from repeated Sparx EA engagements: a model that tries to be the integration documentation ends up being neither good documentation nor a good model.
The package structure separated the map into systems, flows and views, with the views built per audience: one overview per business domain, one per core system showing everything it touches, and the working views used in analysis sessions. Diagrams were views of the model, never drawings — the same discipline we insist on everywhere, since it is what lets a table, a matrix and a diagram agree with each other by construction.
What counts as an application
"About eighty, once the definitional arguments were settled" compresses three weeks of the least glamorous and most consequential work in the engagement, so it deserves unpacking. The raw candidate list, merged from the CMDB, the middleware endpoints and the interviews, held over two hundred names. Getting from two hundred to eighty was not deduplication; it was definition.
The working rule we facilitated was the one we use everywhere: an application is something with its own lifecycle — it can be replaced, retired or upgraded as a unit, and someone would have to plan that. The rule sorted most of the list quickly. The warehouse management system's label-printing add-on fell in (separately licensed, separately upgradeable); its custom report pack fell out (dies with its host). Sixteen country-specific deployments of the same transport management product collapsed into one application with deployment instances, because the product's release cycle, supplier relationship and eventual replacement decision are shared, which is what matters for impact analysis — a decision we revisited once when one country's instance turned out to run two major versions behind, and upheld even then, with the version skew captured as a tagged value instead of a new application. The EDI gateway's forty-odd partner mappings stayed configuration, not applications, over some objection from the team that maintained them and reasonably wanted their work visible; we surfaced that work instead through the flow count on the gateway, which made the same point more honestly.
Every inclusion decision was recorded in the element's notes with a one-line rationale. That habit costs seconds and buys years: the next person who wonders why the label printer is an application and the report pack is not gets an answer instead of an argument.
The map, and what it showed
The assembled map held roughly eighty applications and a few hundred live flows, and its first service to the organisation was simply being looked at. The overview diagrams went up in workshops with operations and IT leadership, and the room did what rooms do in front of an honest landscape picture: found surprises. The ERP had nearly forty distinct consumers of its data, half of them unknown to the programme that intended to replace it. A customer-facing tracking portal turned out to sit at the end of a four-system chain with no monitoring on two of its links — one of them the customs feed the winter incident had silently broken, now visible as structure. And the dead-but-configured paths we had excluded became a small decommissioning list of their own, since configuration that can route messages nobody sends is risk with no return.
We also put numbers where numbers were honest. Fan-in and fan-out per system, computed from the model with a script and refreshed on demand, gave leadership a defensible first-cut shortlist of the systems whose failure or replacement would ripple furthest, read alongside the criticality tags rather than as a verdict on its own. The Relationship Matrix view — systems against systems, cells showing the flows between them — became the artefact the integration developers themselves adopted, because it compressed their mental map into something they could hand to others. That adoption by the people who already knew the answers was the strongest early sign the model would live.
The views themselves were laid out for their audiences, and we treated that as real work rather than decoration. The domain overviews hold to a strict left-to-right convention — customer-facing systems at the left edge, government and partner platforms at the right, the integration layer as a visible band in the middle — so that a reader who has seen one view can navigate all of them. Flows are labelled with their information object, never with technology, because "customs declaration" means something to an operations manager and "SOAP call" does not; mechanism lives in the tagged values and appears only in the technical views. And each overview is capped at what fits on one screen without zooming, with anything denser pushed down into the per-system views. A diagram that needs a magnifying glass is a diagram that will be ignored, and an ignored diagram ages into a wrong one without anyone noticing.
A worked chain: order to customs clearance
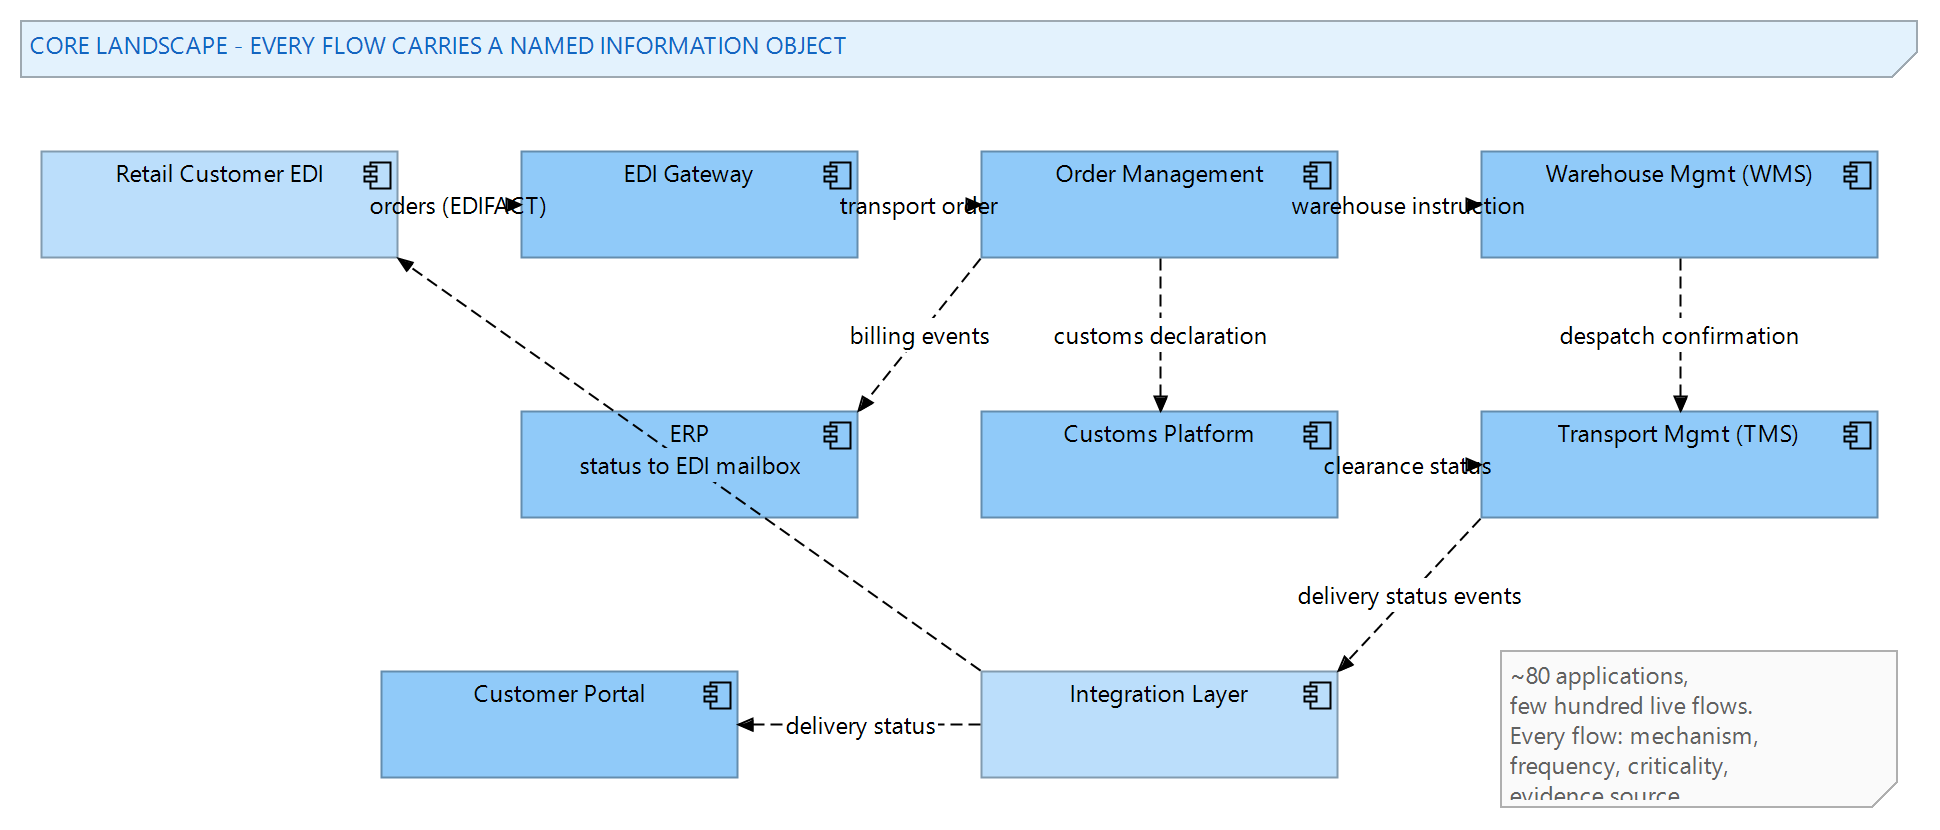
One chain shows the modelling style better than any amount of description, so here is the busiest one in the estate, as it stands in the repository. A retail customer's order arrives at the EDI gateway as an EDIFACT message and flows to the order management system as a transport order. Order management enriches it and sends a warehouse instruction to the warehouse system of the fulfilling site and, for cross-border shipments, a customs declaration request to the customs platform. The customs platform files with the government interface and returns a clearance status; the warehouse confirms picking with a despatch confirmation; the transport system, fed by both, issues the carrier manifest and emits delivery status events that flow through the integration layer to the customer portal and, by a second path, back to the retail customer's own EDI mailbox.
Eight systems, nine named flows, and every sentence in that paragraph is a relationship in the model with a mechanism, frequency, criticality and evidence tag on it. When the map was reviewed, this chain carried two of the engagement's findings: the second status path to the customer mailbox was undocumented anywhere and unknown to the portal team, and the clearance status flow was the one with no monitoring — the winter incident, in structural form. The chain now hangs as a one-page view in the customs team's room, which we mention because it captures something about audience: the model's consumers are not modellers, and a chain they can point at has authority no spreadsheet achieves.
The same chain also illustrates the restraint. The EDIFACT segment structure, the mapping specifications, the queue names — none of it is in the repository. Anyone who needs that depth follows the link on the flow to the integration team's documentation, which is where it was already correct.
From map to impact analysis
A map that is only looked at decays into wallpaper, so the second half of the engagement made it operational. We built a small set of repository searches and scripts, run from within Sparx EA, that turn the model into answers: given a system, list every inbound and outbound flow with its payload, mechanism, criticality and counterpart owner; given an information object, trace every system that produces or consumes it; given a proposed change, generate the notification list of owners whose systems sit within one or two hops. The outputs land as Word documents generated through EA's document templates, and as spreadsheets written directly by the scripts — EA's templates produce documents, not workbooks — because the audience for an impact report is rarely a modelling-tool user — a pattern we describe more generally in our piece on document generation from the repository.
Change requests touching core systems now attach the generated dependency report as a standard step, which moved the two integration developers from answering every question to reviewing the hard ones — the queue shortened, and their knowledge stopped being a single point of failure. The fear premium in estimates did not vanish, but it began attaching to the genuinely hairy systems rather than to everything equally, which is what calibrated fear looks like.
The test of a dependency model is not whether it is complete. It is whether the impact report it generates is trusted enough that people stop scheduling the meeting they used to schedule instead.
The rehearsal: replacing the ERP on paper
The ERP programme gave the model its first serious examination, and we ran it as a deliberate rehearsal. Over two workshops, the programme team walked the replacement scenario against the repository: every flow touching the ERP was classified as migrate, redesign, retire or keep-temporarily, with the classification recorded on copies of the affected flows held in a dedicated scenario package, so the baseline connectors stayed untouched and the rehearsal could be thrown away or kept without ceremony.
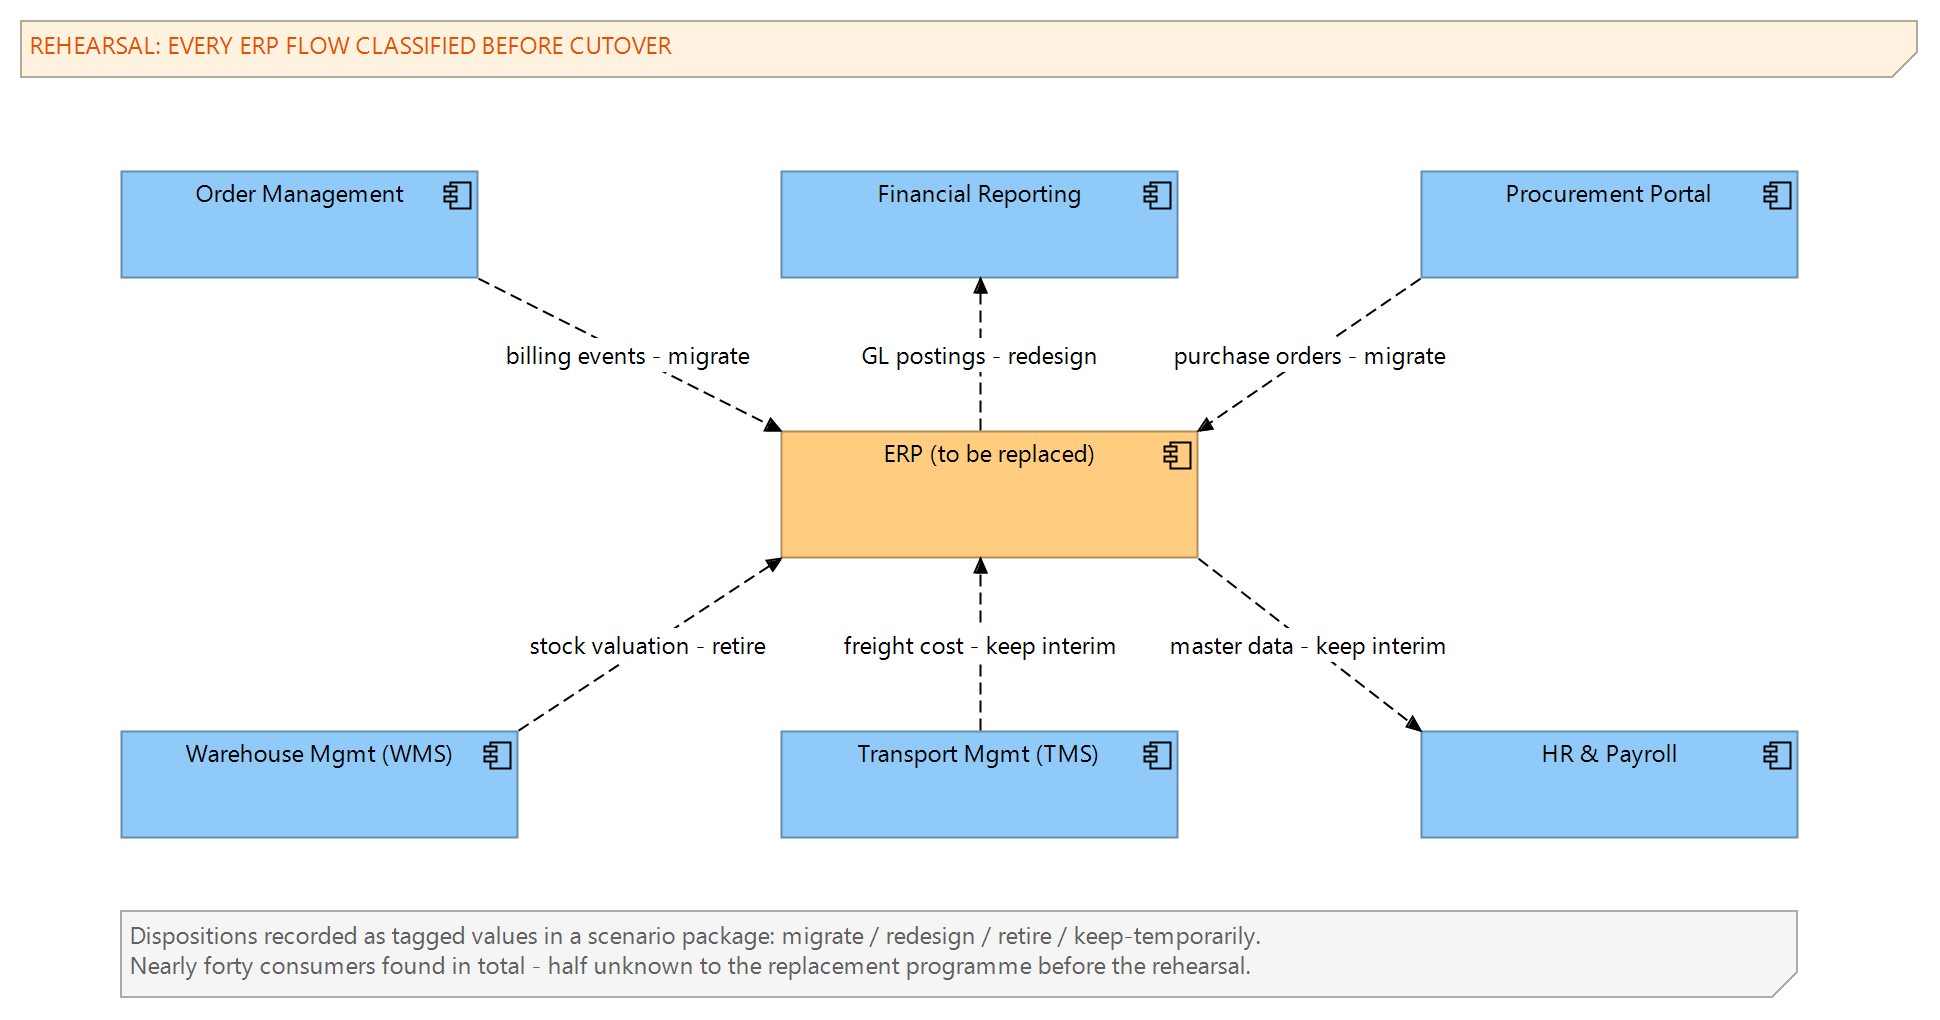
The rehearsal produced three concrete corrections to the programme plan. The cutover sequencing changed once the model showed that two "phase two" consumers depended on a feed scheduled to move in phase one. A planned big-bang replacement of the order interface was split when the fan-out view made the blast radius legible to the steering committee — a diagram achieving in one meeting what the integration developers' warnings had not achieved in three. And the programme discovered it needed a temporary coexistence feed nobody had budgeted, weeks before that discovery would have become expensive. The programme director's summary at the closing workshop was the sentence we quote internally: "this is the first time the interface list has been something we argue from rather than about".
Keeping the map alive
Dependency maps have a natural half-life, and every mechanism we left behind exists to lengthen it. The middleware configuration export became a scheduled comparison: a script re-harvests the routing table monthly and diffs it against the model, so a flow added in the middleware without appearing in the repository surfaces as an exception rather than a slow divergence. The exception list goes to the integration team lead, and its normal length is zero to three lines. Change management closed the other loop — the same process step that attaches the dependency report also requires the model update when the change lands, checked lightly at implementation review.
We trained four people across the integration and architecture teams to maintain the model, deliberately spanning both groups so the map would belong to the seam rather than to one side of it. Maintenance costs them, by their own accounting, a few hours a month in steady state. The model earns that back on the first non-trivial impact question, and the organisation asks several of those a month; the arithmetic is not close.
Twice a year the map gets a heavier service: a half-day review where the maintainers walk the exception history, retire flows that stopped flowing, and check the criticality markers against the past six months of incidents — the one attribute experience keeps proving optimistic. The first such review reclassified four flows upward after a queue outage demonstrated that "stops neither trucks nor invoices" had been wishful thinking for two of them. That feedback loop, from operational reality back into the model's judgements, is what separates a dependency map from a dependency mural, and scheduling it twice a year costs less than one bad estimate.
What changed for the organisation
A year on, the observable changes: impact questions that queued for days are answered in an afternoon, mostly self-service. The ERP programme runs its interface workstream from the repository, and its plan survived contact with cutover in the places the model had been consulted. The winter-incident pattern — a change silently starving a downstream consumer — has recurred once, on a flow that was in the model, flagged, and simply not checked; the process gap was fixed the same week, and the model's reputation survived because the failure was traceable to a step skipped rather than a fact missing.
Less measurably but more importantly, the organisation stopped treating its integration landscape as folklore. New joiners in the integration team are walked through the map in their first week. Two customer due-diligence questionnaires were answered from the repository directly. And the phrase "what talks to what" now has an address rather than two names attached to it.
Where the approach reaches its limits
Named limits, of which there are three. The model describes structure, not behaviour: it knows the customs platform consumes declarations, not what happens operationally when the feed stalls for six hours — sequencing, retry behaviour and failure semantics live in runbooks and monitoring, and pretending a structural model covers them would be false comfort. Second, the evidence-first method sees what leaves traces. The shared-folder integrations and the undocumented database job were caught by interviews, not harvesting, and we assume the map still misses a small number of similar paths; the monthly diff catches drift in the middleware's world, not outside it. Third, the map's currency depends on a process discipline the organisation must keep choosing — the mechanisms lower the cost of the discipline, they do not remove the need for it.
Within those limits, the pattern is one of the most reliably valuable we know: harvest the evidence, model the flows with named payloads, put the analysis one script away, and wire the upkeep into change management. If your organisation is facing a system replacement with an interface landscape it cannot see — or has two irreplaceable people where a model should be — we have walked this path often, and you can reach us through our contact page.
This case study describes a representative engagement pattern. Organisational details are illustrative and do not identify a specific client.